Is the oil price collapse good for gold? How should investors strategize before safe-haven funds return to the market?
2026-03-11 20:49:21
On Wednesday, March 11th, before the US market opened, spot gold prices fluctuated between $5190 and $5200 per ounce, but clearly rebounded from previous lows. This recovery was directly driven by the US dollar index falling from its high to around 99, oil prices correcting from a high of $120 per barrel to the $90 per barrel range, and signs of easing tensions in the Middle East, leading to a gradual stabilization of risk sentiment. Traders should pay close attention to how these factors will affect the cost of holding gold and its safe-haven appeal.
A weaker dollar directly reduced the opportunity cost of holding non-interest-bearing assets, while a pullback in oil prices eased potential inflationary pressures, leaving room for future policy adjustments. Signs of easing geopolitical risks in the Middle East further stabilized the market, preventing excessive squeeze on safe-haven funds. OCBC strategists pointed out that gold continued its recovery as the dollar and oil prices fell, while risk sentiment temporarily stabilized due to signs that the conflict in Iran might be nearing its end. The price action also aligns with previous assessments that asset liquidation under market pressure had hindered gold's breakout, and demand is expected to return after this phase ends.
The above levels clearly outline the current trading range, with 5100-5060 serving as a short-term support level, close to the key moving average support, while 5260-5300 constitutes a dense selling pressure zone above.
Gold prices were previously under pressure due to a confluence of factors, including asset liquidation demand during periods of market stress, a slowdown in official gold purchases, and the Federal Reserve's reduced expectations of interest rate cuts due to inflationary risks stemming from oil prices. Central bank net gold purchases totaled approximately 850 tons in 2025, averaging 27 tons per month, but net purchases plummeted to 5 tons in January 2026, a temporary slowdown that exacerbated short-term supply pressures. OCBC strategists emphasized that other dragging factors included the possibility that the Federal Reserve might postpone its next rate cut, as rising oil prices could push up US inflation risks. Once the safe-haven phase subsides, previous actions will gradually unwind, and gold demand is expected to restart. The dollar index falling back to 99 further confirms improved liquidity conditions, while the oil price correction has reduced uncertainty about the Federal Reserve's policy path. These changes are laying the foundation for a medium- to long-term stabilization of gold prices.
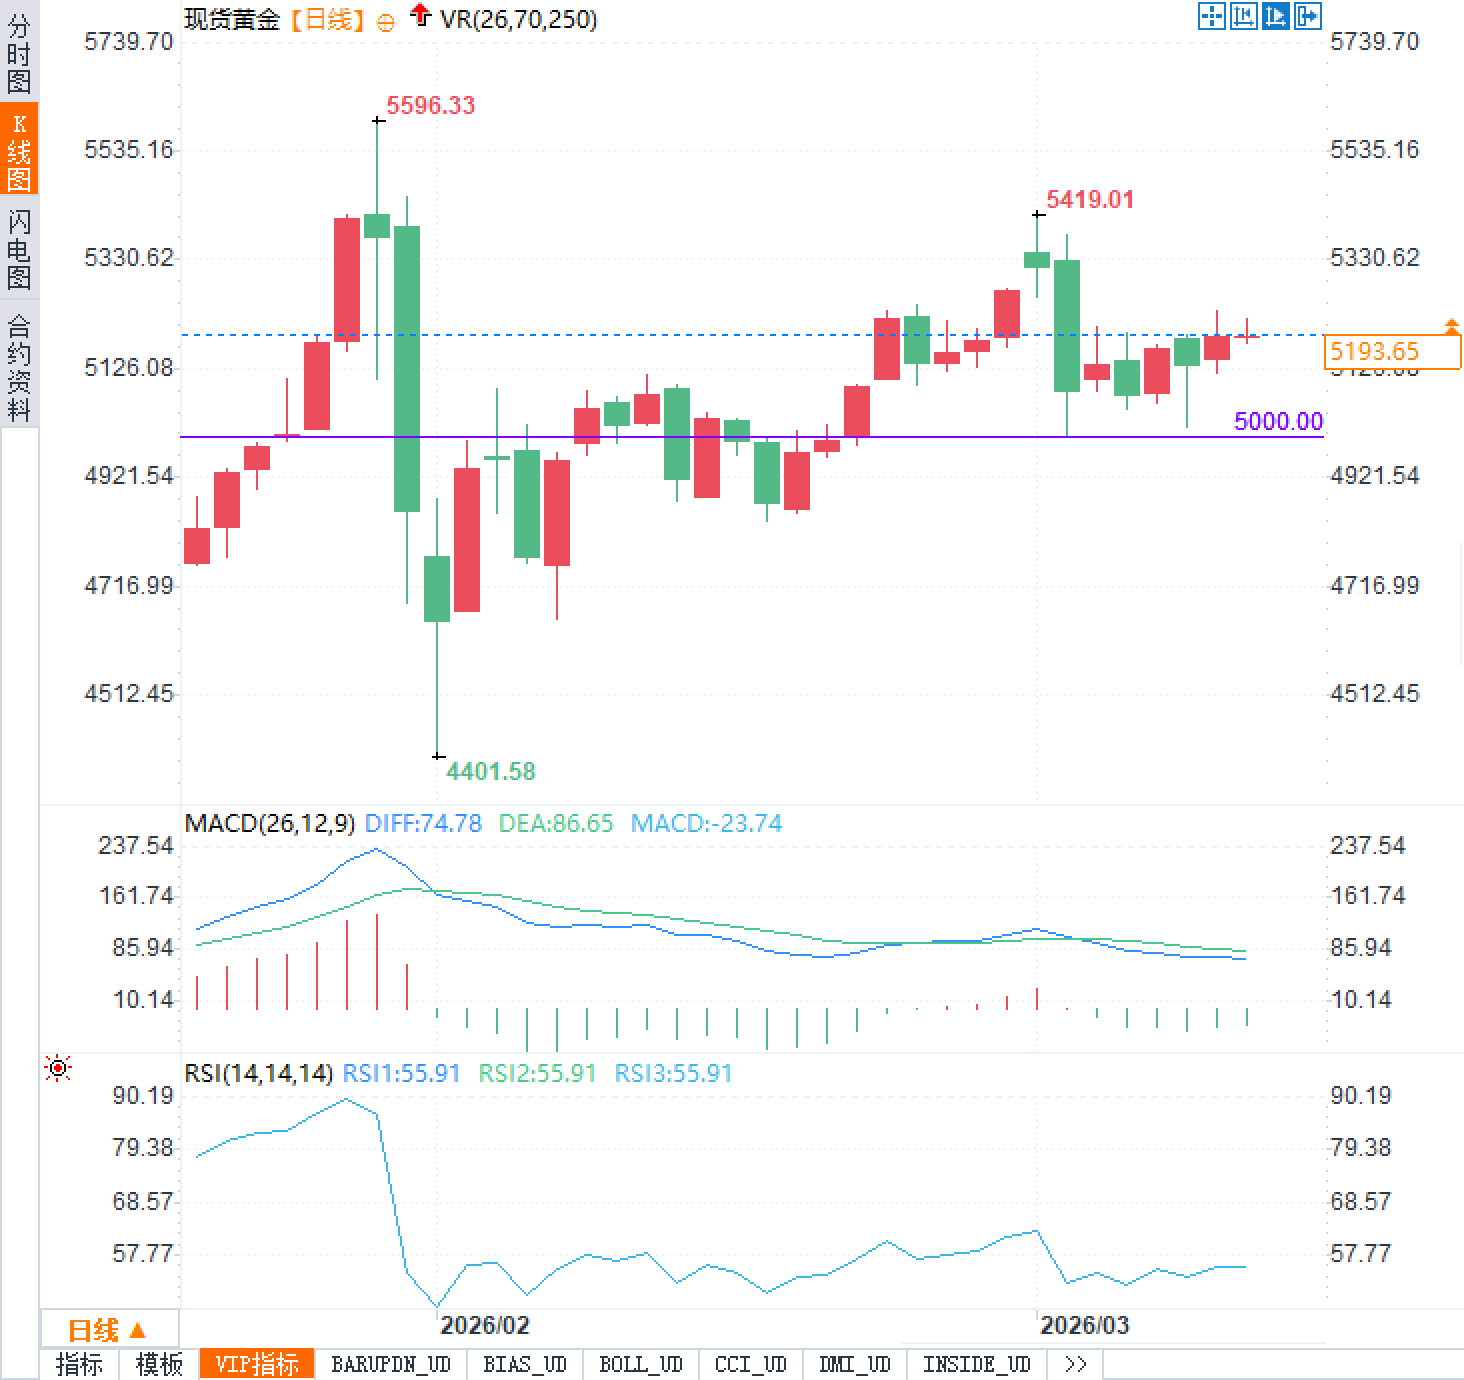
The daily chart shows that gold prices have rebounded after falling from a high of $5,596.33/oz to a low of $5,000/oz, and are currently stabilizing around $5,190/oz. The MACD indicator shows a DIFF value of 74.78, a DEA value of 86.65, and a MACD value of -23.74. Although the histogram is still negative, the contraction trend is obvious, suggesting that the momentum divergence is easing. The RSI(14) reading is 55.9, in the neutral range, neither overbought nor oversold, reflecting a balanced market. The $5,100-$5,060/oz range forms strong support; holding this level will provide momentum for further upward movement towards the $5,260-$5,300/oz resistance level.
As the pressure from previous liquidations subsides, structural demand for gold as a diversified reserve asset will regain attention. Although official gold purchases slowed in January, the full-year forecast remains strong at around 800 tons, coupled with lingering geopolitical uncertainty, solidifying the long-term buying base. The Federal Reserve's current interest rate range of 3.5%-3.75% and the decline in oil prices help alleviate inflation concerns, creating room for future easing expectations. Once risk sentiment fully stabilizes, gold's safe-haven appeal will re-emphasize, and its price center is expected to gradually shift upwards. Traders are focusing on the interconnected effects of the dollar, oil prices, and geopolitical dynamics, as these factors collectively determine the sustainability of the recovery.
Immediate drivers of the gold price rebound
A weaker dollar directly reduced the opportunity cost of holding non-interest-bearing assets, while a pullback in oil prices eased potential inflationary pressures, leaving room for future policy adjustments. Signs of easing geopolitical risks in the Middle East further stabilized the market, preventing excessive squeeze on safe-haven funds. OCBC strategists pointed out that gold continued its recovery as the dollar and oil prices fell, while risk sentiment temporarily stabilized due to signs that the conflict in Iran might be nearing its end. The price action also aligns with previous assessments that asset liquidation under market pressure had hindered gold's breakout, and demand is expected to return after this phase ends.
| category | Price level (USD/ounce) |
|---|---|
| Previous high | 5596.33 |
| Current price | 5190 |
| Recent lows | 5000 |
| Support range | 5100-5060 |
| resistance zone | 5260-5300 |
The gradual removal of the suppressing factors in the early stage
Gold prices were previously under pressure due to a confluence of factors, including asset liquidation demand during periods of market stress, a slowdown in official gold purchases, and the Federal Reserve's reduced expectations of interest rate cuts due to inflationary risks stemming from oil prices. Central bank net gold purchases totaled approximately 850 tons in 2025, averaging 27 tons per month, but net purchases plummeted to 5 tons in January 2026, a temporary slowdown that exacerbated short-term supply pressures. OCBC strategists emphasized that other dragging factors included the possibility that the Federal Reserve might postpone its next rate cut, as rising oil prices could push up US inflation risks. Once the safe-haven phase subsides, previous actions will gradually unwind, and gold demand is expected to restart. The dollar index falling back to 99 further confirms improved liquidity conditions, while the oil price correction has reduced uncertainty about the Federal Reserve's policy path. These changes are laying the foundation for a medium- to long-term stabilization of gold prices.
Interpretation of Key Technical Levels and Indicators
The daily chart shows that gold prices have rebounded after falling from a high of $5,596.33/oz to a low of $5,000/oz, and are currently stabilizing around $5,190/oz. The MACD indicator shows a DIFF value of 74.78, a DEA value of 86.65, and a MACD value of -23.74. Although the histogram is still negative, the contraction trend is obvious, suggesting that the momentum divergence is easing. The RSI(14) reading is 55.9, in the neutral range, neither overbought nor oversold, reflecting a balanced market. The $5,100-$5,060/oz range forms strong support; holding this level will provide momentum for further upward movement towards the $5,260-$5,300/oz resistance level.
Demand recovery and market outlook
As the pressure from previous liquidations subsides, structural demand for gold as a diversified reserve asset will regain attention. Although official gold purchases slowed in January, the full-year forecast remains strong at around 800 tons, coupled with lingering geopolitical uncertainty, solidifying the long-term buying base. The Federal Reserve's current interest rate range of 3.5%-3.75% and the decline in oil prices help alleviate inflation concerns, creating room for future easing expectations. Once risk sentiment fully stabilizes, gold's safe-haven appeal will re-emphasize, and its price center is expected to gradually shift upwards. Traders are focusing on the interconnected effects of the dollar, oil prices, and geopolitical dynamics, as these factors collectively determine the sustainability of the recovery.
Frequently Asked Questions
Question 1: Why has gold rebounded recently?
A: A weaker dollar and lower oil prices were the main catalysts, while signs of easing tensions in the Middle East stabilized market risk sentiment. OCBC strategists analyzed that gold prices were previously under pressure due to asset liquidation under market stress, a slowdown in official gold purchases, and expectations that the Federal Reserve would postpone interest rate cuts due to oil price inflation risks. However, as risk aversion subsides, demand for gold as a safe-haven asset is expected to gradually return.
Question 2: What are the key support and resistance levels in technical analysis?
A: Key support lies in the $5100-$5060/oz range, while resistance is at $5260-$5300/oz. The chart shows a high of $5596.33 and a low of $5000. The price has recently rebounded from its lows. The RSI is around 55.91, which is neutral, and the MACD is slightly negative, but price action indicates signs of recovery. Traders can use this information to assess the trading range.
Question 3: What does the change in the central bank's gold purchasing trend mean for gold prices?
A: Although official net gold purchases slowed to 5 tons in January 2026, total purchases for 2025 were approximately 850 tons, and are expected to remain at a robust level of around 800 tons in 2026. This trend of diversified reserves provides structural support. Combined with the Fed's policy dynamics, a recovery in gold demand as liquidity needs ease will support the medium- to long-term upside potential for prices.
- Risk Warning and Disclaimer
- The market involves risk, and trading may not be suitable for all investors. This article is for reference only and does not constitute personal investment advice, nor does it take into account certain users’ specific investment objectives, financial situation, or other needs. Any investment decisions made based on this information are at your own risk.