The "inflation bomb" of soaring oil prices has been detonated, and US Treasury yields are approaching a critical level. Is gold about to be squeezed out?
2026-03-12 21:28:37
On Thursday (March 12), in the current global financial markets, changes in US Treasury yields have become the core driver of pricing logic. The market exhibits an extremely complex "stagflation" pricing characteristic. Influenced by the strong "stickiness" of the US February CPI inflation data and the sharp deterioration of the Middle East geopolitical situation, the US dollar index (DXY) and US Treasury yields strengthened in tandem, creating a situation of both structural pressure and support for the traditional safe-haven asset, spot gold.
As core inflation in the US failed to slow as significantly as expected, major institutions have generally lowered their expectations for a near-term interest rate cut by the Federal Reserve, with the market currently pricing in almost no probability of a rate cut in March. This expectation of a "higher and longer" interest rate path has directly driven the 10-year US Treasury yield upwards, while also providing solid interest rate differential support for the US dollar. However, escalating shipping security risks in the Persian Gulf have led to sharp fluctuations in oil prices, exacerbating inflation concerns and stimulating market demand for safe-haven assets.
The current strength of the US dollar is essentially an extension of the US Treasury market's pricing in macroeconomic data and geopolitical risks.
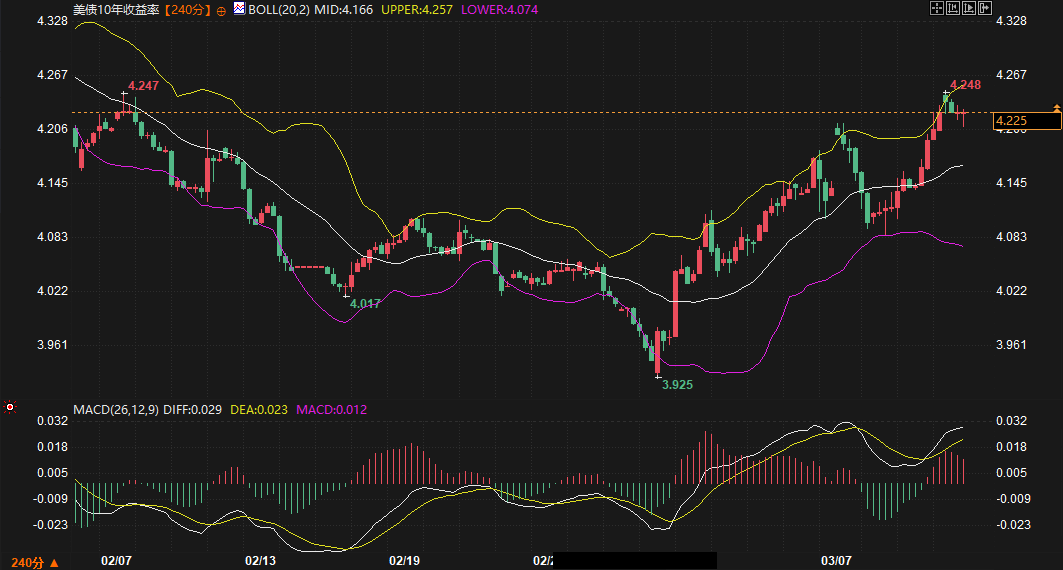
Fundamental Logic : The release of the US February CPI data was the catalyst for this round of volatility. The data showed that inflationary pressures remained robust, causing the 10-year US Treasury yield to rise rapidly from 4.207% to around 4.228%. At the same time, the US labor market demonstrated strong resilience, with weekly initial jobless claims unexpectedly falling to 213,000, lower than market expectations. This strong economic fundamentals not only supported interest rate expectations but also gave the US dollar an advantage in the interest rate differential game with other currencies. Furthermore, rising energy prices, transmitted through inflation expectations to the bond market, further pushed up the nominal yield of US Treasuries, thereby driving the US dollar index to maintain a volatile but upward trend at high levels.
Technical Analysis : From a 240-minute chart perspective, the US Dollar Index is currently trading around 99.4723, with the price closely following the upper Bollinger Band. Although the MACD histogram continues to show upward momentum, the slowing slope suggests a certain risk of consolidation at these high levels.
Resistance range prediction: Key resistance levels to watch are the previous high of 99.6950 and the upper Bollinger Band area of 99.68. A successful break above this range would open up room for the US dollar to move towards the 100 level.
Support range prediction: The first support level is at the Bollinger Middle Band at 99.06, and further support is expected at the previous low of 98.44.
Key points to watch during trading: Be wary of pullback pressure after short-term high-level fluctuations, especially when US Treasury yields show signs of exhaustion in their upward momentum.
Gold is currently at a point of equilibrium between a "geopolitical safe-haven premium" and "US Treasury yield suppression".
Fundamental Logic : The escalating situation in the Middle East is the core support for gold's resilience. According to maritime data, seven ships were attacked in the Persian Gulf region within 24 hours, with the attack near Jebel Ali port marking a sharp escalation. This extreme risk aversion usually directly pushes up gold prices. However, the unique aspect of this round of market activity is that geopolitical risks have simultaneously driven up oil prices (once exceeding $100/barrel), which in turn has increased inflation expectations and US Treasury yields. As the opportunity cost of holding gold, the rise in US Treasury yields has created a clear "ceiling" effect on gold. Therefore, gold is exhibiting a pattern of high-level consolidation rather than a one-sided surge.
Technical Analysis : Spot gold is currently trading at $5185.17, between the middle Bollinger Band (5169) and the upper Bollinger Band (5248) on the 4-hour chart. The MACD indicator shows that the DIFF line has slightly crossed below the DEA line, indicating a slight weakening of short-term upward momentum. The bulls and bears are engaged in a fierce battle around the $5200 level.
Resistance range prediction: The key resistance levels to watch are 5248 (upper Bollinger Band) and the previous high of 5419.
Support range prediction: The first support level to watch is the Bollinger Middle Band at 5169. If this level is broken, the price may fall to the 4996 to 5091 (Bollinger Lower Band) range.
Key points to watch during trading: Focus on the transmission of oil price fluctuations to the bond market. If US Treasury yields get out of control due to overheated inflation expectations, gold may experience wide fluctuations due to changes in real interest rates.
Looking ahead to the next two to three trading days, the market's main theme will continue to revolve around "bond pricing." Given the lack of public speeches from Federal Reserve officials in the short term, the market will be highly dependent on real-time external events.
First, whether the US Treasury yield can hold above the 4.25% level is crucial. From the current level of 4.225%, there is still technical upside potential. If yields continue to rise, the US dollar will maintain its dominance, while gold may face downward pressure after safe-haven buying dries up. Second, unexpected geopolitical developments are the biggest variable; any deep concerns about disruptions to the energy supply chain will reinforce the bottoming pattern for gold.
Overall, the market is undergoing a shift from being driven by "policy expectations" to being driven by "risk premiums." The extreme scenario of the US dollar and gold rising simultaneously may occur from time to time in the coming days, but this usually indicates a rapid increase in market volatility. Investors should closely monitor the touching of the upper and lower Bollinger Bands, and whether the MACD shows a clear bearish divergence signal at high levels.
Question 1: Why did US Treasury yields and the US dollar strengthen even though the US CPI data met expectations?
A: This is mainly because the market is not only focused on whether the data itself "exceeds the limit," but also on the "stickiness" of inflation. February CPI data showed that core inflation was struggling to decline, shattering market hopes for a Fed rate cut in March or April. As rate cut expectations are postponed, the yield premium on US Treasury bonds will rise again. Since US Treasury yields are the cornerstone of dollar pricing, higher yields naturally attract capital back to dollar assets, thereby pushing the dollar index higher.
Question 2: Given the recent tensions in the Middle East, why hasn't gold experienced a continuous surge, but instead shown a fluctuating trend?
A: This is precisely the "bond market transmission effect" that this article focuses on. Geopolitical factors have indeed brought safe-haven buying, but they have also pushed up oil prices. Rising oil prices, in turn, have increased inflation expectations, leading to a rise in US Treasury yields. As a non-interest-bearing asset, gold is suppressed when US Treasury yields (the opportunity cost of holding gold) rise. Currently, gold is in a state where the "push" from safe-haven demand and the "resistance" from high yields are offsetting each other, thus exhibiting high-level fluctuations.
Question 3: The US dollar index is currently approaching the 100 mark. From a technical perspective, is there a risk that it has peaked and will fall back?
A: Looking at the 240-minute chart, the US dollar index is closely following the upper Bollinger Band, and while the MACD histogram remains bullish, its slope has slowed, reflecting signs of overbought conditions. However, as long as the 10-year US Treasury yield stays above 4.2%, the dollar's downside will be limited. Unless there is significant economic data weakness or an unexpected de-escalation in geopolitical tensions, the dollar is more likely to consolidate at its current high levels in the short term.
Question 4: How do oil price fluctuations affect conventional analytical logic through the US Treasury market?
A: This is a multi-layered transmission process: rising oil prices → increased costs for businesses and households → higher inflation expectations → investors demanding higher US Treasury yields as compensation → falling US Treasury prices/rising yields. Since US Treasury yields are the anchor for global asset pricing, this change will quickly transmit to the US dollar (strengthening) and gold (cost suppression). In this analysis, the impact of oil prices on the bond market is the key to understanding the interaction among these three factors.
Question 5: In the next 2-3 days, which key indicator should ordinary investors keep a close eye on?
A: The most crucial "leading indicator" is the 4.25% resistance level of the 10-year US Treasury yield. If the yield breaks through this level strongly, it indicates that the market is pricing in longer-term inflation risks, at which point the US dollar may rise further. Conversely, if the yield is resisted at the upper Bollinger Band and falls back, gold may get a breather and launch a new round of upward testing.
As core inflation in the US failed to slow as significantly as expected, major institutions have generally lowered their expectations for a near-term interest rate cut by the Federal Reserve, with the market currently pricing in almost no probability of a rate cut in March. This expectation of a "higher and longer" interest rate path has directly driven the 10-year US Treasury yield upwards, while also providing solid interest rate differential support for the US dollar. However, escalating shipping security risks in the Persian Gulf have led to sharp fluctuations in oil prices, exacerbating inflation concerns and stimulating market demand for safe-haven assets.
Analyzing the US Dollar's Trend from the Perspective of US Treasury Bonds: Driven by Both Interest Rate Premium and Inflation Expectations
The current strength of the US dollar is essentially an extension of the US Treasury market's pricing in macroeconomic data and geopolitical risks.
Fundamental Logic : The release of the US February CPI data was the catalyst for this round of volatility. The data showed that inflationary pressures remained robust, causing the 10-year US Treasury yield to rise rapidly from 4.207% to around 4.228%. At the same time, the US labor market demonstrated strong resilience, with weekly initial jobless claims unexpectedly falling to 213,000, lower than market expectations. This strong economic fundamentals not only supported interest rate expectations but also gave the US dollar an advantage in the interest rate differential game with other currencies. Furthermore, rising energy prices, transmitted through inflation expectations to the bond market, further pushed up the nominal yield of US Treasuries, thereby driving the US dollar index to maintain a volatile but upward trend at high levels.
Technical Analysis : From a 240-minute chart perspective, the US Dollar Index is currently trading around 99.4723, with the price closely following the upper Bollinger Band. Although the MACD histogram continues to show upward momentum, the slowing slope suggests a certain risk of consolidation at these high levels.
Resistance range prediction: Key resistance levels to watch are the previous high of 99.6950 and the upper Bollinger Band area of 99.68. A successful break above this range would open up room for the US dollar to move towards the 100 level.
Support range prediction: The first support level is at the Bollinger Middle Band at 99.06, and further support is expected at the previous low of 98.44.
Key points to watch during trading: Be wary of pullback pressure after short-term high-level fluctuations, especially when US Treasury yields show signs of exhaustion in their upward momentum.
Gold Analysis: The Tug-of-War Between the Safe-Haven Effect Transmitted from the Bond Market and the Pressure on Interest Rates
Gold is currently at a point of equilibrium between a "geopolitical safe-haven premium" and "US Treasury yield suppression".
Fundamental Logic : The escalating situation in the Middle East is the core support for gold's resilience. According to maritime data, seven ships were attacked in the Persian Gulf region within 24 hours, with the attack near Jebel Ali port marking a sharp escalation. This extreme risk aversion usually directly pushes up gold prices. However, the unique aspect of this round of market activity is that geopolitical risks have simultaneously driven up oil prices (once exceeding $100/barrel), which in turn has increased inflation expectations and US Treasury yields. As the opportunity cost of holding gold, the rise in US Treasury yields has created a clear "ceiling" effect on gold. Therefore, gold is exhibiting a pattern of high-level consolidation rather than a one-sided surge.
Technical Analysis : Spot gold is currently trading at $5185.17, between the middle Bollinger Band (5169) and the upper Bollinger Band (5248) on the 4-hour chart. The MACD indicator shows that the DIFF line has slightly crossed below the DEA line, indicating a slight weakening of short-term upward momentum. The bulls and bears are engaged in a fierce battle around the $5200 level.
Resistance range prediction: The key resistance levels to watch are 5248 (upper Bollinger Band) and the previous high of 5419.
Support range prediction: The first support level to watch is the Bollinger Middle Band at 5169. If this level is broken, the price may fall to the 4996 to 5091 (Bollinger Lower Band) range.
Key points to watch during trading: Focus on the transmission of oil price fluctuations to the bond market. If US Treasury yields get out of control due to overheated inflation expectations, gold may experience wide fluctuations due to changes in real interest rates.
Future Trend Outlook: Bond market pricing logic will dominate market performance in the next 2-3 days.
Looking ahead to the next two to three trading days, the market's main theme will continue to revolve around "bond pricing." Given the lack of public speeches from Federal Reserve officials in the short term, the market will be highly dependent on real-time external events.
First, whether the US Treasury yield can hold above the 4.25% level is crucial. From the current level of 4.225%, there is still technical upside potential. If yields continue to rise, the US dollar will maintain its dominance, while gold may face downward pressure after safe-haven buying dries up. Second, unexpected geopolitical developments are the biggest variable; any deep concerns about disruptions to the energy supply chain will reinforce the bottoming pattern for gold.
Overall, the market is undergoing a shift from being driven by "policy expectations" to being driven by "risk premiums." The extreme scenario of the US dollar and gold rising simultaneously may occur from time to time in the coming days, but this usually indicates a rapid increase in market volatility. Investors should closely monitor the touching of the upper and lower Bollinger Bands, and whether the MACD shows a clear bearish divergence signal at high levels.
Frequently Asked Questions
Question 1: Why did US Treasury yields and the US dollar strengthen even though the US CPI data met expectations?
A: This is mainly because the market is not only focused on whether the data itself "exceeds the limit," but also on the "stickiness" of inflation. February CPI data showed that core inflation was struggling to decline, shattering market hopes for a Fed rate cut in March or April. As rate cut expectations are postponed, the yield premium on US Treasury bonds will rise again. Since US Treasury yields are the cornerstone of dollar pricing, higher yields naturally attract capital back to dollar assets, thereby pushing the dollar index higher.
Question 2: Given the recent tensions in the Middle East, why hasn't gold experienced a continuous surge, but instead shown a fluctuating trend?
A: This is precisely the "bond market transmission effect" that this article focuses on. Geopolitical factors have indeed brought safe-haven buying, but they have also pushed up oil prices. Rising oil prices, in turn, have increased inflation expectations, leading to a rise in US Treasury yields. As a non-interest-bearing asset, gold is suppressed when US Treasury yields (the opportunity cost of holding gold) rise. Currently, gold is in a state where the "push" from safe-haven demand and the "resistance" from high yields are offsetting each other, thus exhibiting high-level fluctuations.
Question 3: The US dollar index is currently approaching the 100 mark. From a technical perspective, is there a risk that it has peaked and will fall back?
A: Looking at the 240-minute chart, the US dollar index is closely following the upper Bollinger Band, and while the MACD histogram remains bullish, its slope has slowed, reflecting signs of overbought conditions. However, as long as the 10-year US Treasury yield stays above 4.2%, the dollar's downside will be limited. Unless there is significant economic data weakness or an unexpected de-escalation in geopolitical tensions, the dollar is more likely to consolidate at its current high levels in the short term.
Question 4: How do oil price fluctuations affect conventional analytical logic through the US Treasury market?
A: This is a multi-layered transmission process: rising oil prices → increased costs for businesses and households → higher inflation expectations → investors demanding higher US Treasury yields as compensation → falling US Treasury prices/rising yields. Since US Treasury yields are the anchor for global asset pricing, this change will quickly transmit to the US dollar (strengthening) and gold (cost suppression). In this analysis, the impact of oil prices on the bond market is the key to understanding the interaction among these three factors.
Question 5: In the next 2-3 days, which key indicator should ordinary investors keep a close eye on?
A: The most crucial "leading indicator" is the 4.25% resistance level of the 10-year US Treasury yield. If the yield breaks through this level strongly, it indicates that the market is pricing in longer-term inflation risks, at which point the US dollar may rise further. Conversely, if the yield is resisted at the upper Bollinger Band and falls back, gold may get a breather and launch a new round of upward testing.
- Risk Warning and Disclaimer
- The market involves risk, and trading may not be suitable for all investors. This article is for reference only and does not constitute personal investment advice, nor does it take into account certain users’ specific investment objectives, financial situation, or other needs. Any investment decisions made based on this information are at your own risk.