Oil price surge + Japanese bond collapse: The yen is sliding into an abyss! Katayama Satsuki makes a bold statement, will Japan dare to launch a strong attack on 160?
2026-03-13 18:10:03
On Friday (March 13), the global foreign exchange market focused on the yen's movement. Today, the USD/JPY exchange rate climbed to around 159.69, a level that not only broke the record high since Japanese authorities intervened in July 2024, but also pushed market sentiment to an extremely tense state. With rising Japanese bond yields across the board, increasing pressure on energy prices, and frequent verbal interventions from monetary authorities, the yen is facing a severe tug-of-war between bulls and bears.
The Japanese government bond (JGB) market experienced a significant sell-off today, a move that became a key factor supporting the strengthening of the US dollar against the yen. Influenced by rising expectations of interest rate hikes and persistently high international oil prices , JGB yields rose across the board. The 10-year JGB, in particular, saw the most intense selling pressure.
1. The inherent logic of the policy shift to hawkishness
Market expectations for a Bank of Japan (BoJ) interest rate hike are undergoing a fundamental shift. Despite risks to economic growth, rising energy costs due to geopolitical tensions may force the central bank to adopt a more hawkish stance. This expectation was fully reflected in today's trading: the 5-year JGB yield briefly broke through 1.645%, up 2 basis points from the previous day; the 10-year yield climbed even higher to over 2.205%.
2. Fiscal pressure and energy subsidies
The Takamura administration recently stated that, in order to address the energy crisis, the government plans to utilize oil reserves and provide substantial subsidies, aiming to stabilize the average gasoline price at around 170 yen per liter. However, if international oil prices remain high, the subsidy costs will far exceed the budget, meaning the Japanese government may need to raise funds by issuing more JGBs. The potential increase in supply further pushes up yields, creating a flattened yield curve characteristic of a bear market .
3. Unexpected Signals from the Transitional Bond Auction
It is worth noting that today's 10-year transition bond auction performed well, with a closing yield of 2.195% and a 1 basis point "greenium" premium. Despite the favorable auction results, it failed to alleviate selling pressure in the secondary market, reflecting traders' cautious risk-averse mentality ahead of a policy shift, with funds flowing from longer-term instruments to more liquid spot instruments.
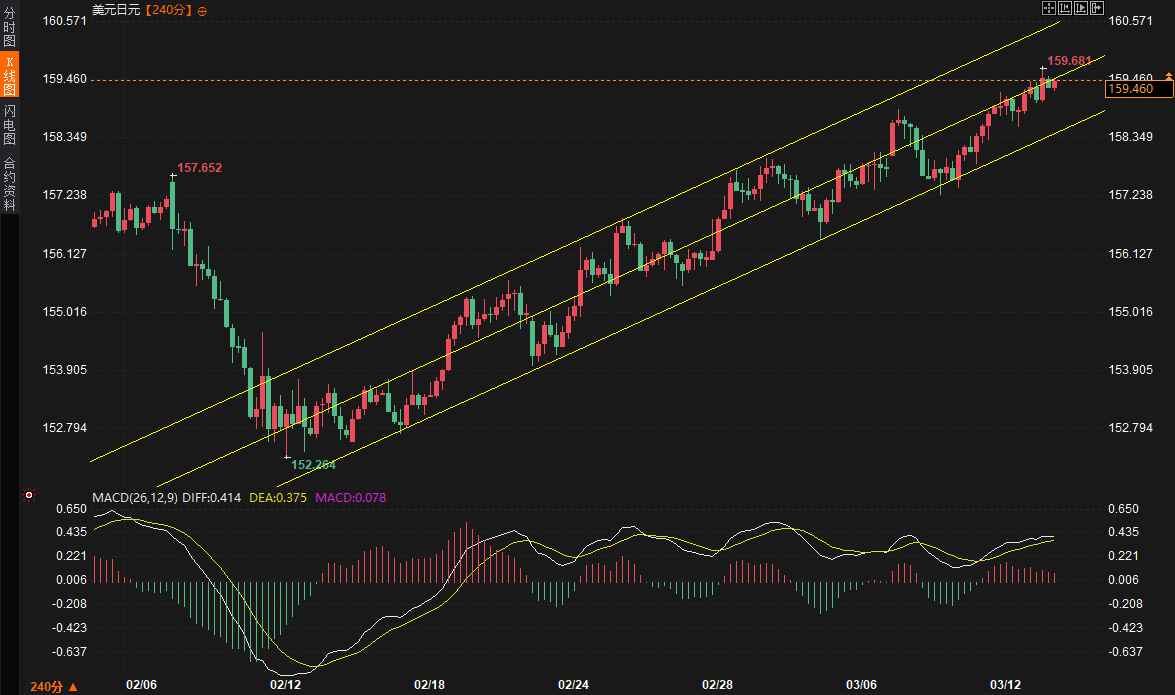
From the 240-minute (4-hour) candlestick chart, the USD/JPY pair is currently in a very clear and strong medium-term uptrend .
Trend Stage Analysis
A stepped upward trend: Since hitting a low of 152.284 on February 12, the exchange rate has steadily risen along a standard yellow ascending channel . This is characterized by continuously rising lows and a successful recovery of the early February high of 157.652, demonstrating extremely strong bullish momentum.
Current position: The latest price of 159.460 is approaching the upper edge of the channel. In the short term, it has been fluctuating slightly in this area. The appearance of the upper shadow line suggests heavy selling pressure in the 159.5-159.7 range.
Interpretation of the MACD indicator
Strong bullish trend: Currently, the DIFF line (0.414) and DEA line (0.375) of the MACD (26, 12, 9) are both running above the 0 axis, establishing the dominance of the bullish market.
No divergence signs: Although the exchange rate hit a new high, the MACD red bars did not show obvious top divergence, which means that the current rise is driven by real buying and there are no obvious signs of momentum exhaustion.
As the yen approaches the 160 mark, statements from Japanese finance ministry officials have become increasingly assertive. Finance Minister Satsuki Katayama stated today that the government is prepared to take all necessary measures to address exchange rate fluctuations that could impact people's lives, and emphasized maintaining close communication with the United States.
However, there are differing opinions within the market. Some insiders privately believe that, given the current international context, the effectiveness of unilateral intervention may be limited. If geopolitical risks lead to a surge in demand for the US dollar, any intervention to sell off dollars could be quickly swallowed up by the massive market liquidity.
Key technological "gap"
If the authorities intervene directly, there is significant downside potential from a technical perspective. On the daily chart, the emotional volatility triggered by the current regime's rise to power last October left a significant gap between 147.45 and 149.02. Based on the rule of thumb that "gaps must be filled," this range will become the primary target for any pullback as some upward pressure triggers stop-loss orders.
Based on the current 4-hour chart channel and market sentiment, the following is a short-term reference range:
Resistance range: 159.70 - 160.50. 159.70 is the upper edge of the current channel and the recent high, while 160.00 is a psychologically significant round number. If it can hold above 159.70, the upside potential will open up further.
Support range: 158.30 - 157.65. 158.30 corresponds to the lower edge of the channel support, while 157.65, as the previous breakout level, has now transformed into an important polarity reversal support.
Key points to watch during trading: Closely monitor whether the 10-year Japanese government bond yield can hold above 2.25%, and the impact of oil price fluctuations on the yen's safe-haven appeal.
In the short term, the USD/JPY pair remains within a strong upward channel, with no technical reversal signals yet. However, from a fundamental perspective, the yen has entered an "intervention alert zone," and volatility is likely to increase significantly. The market is in an extremely sensitive period; any rumors about the Bank of Japan raising interest rates earlier than expected or specific details about the release of government oil reserves could trigger sharp fluctuations in the exchange rate. It is advisable to pay attention to the high correlation between USD/JPY and EUR/JPY (correlation coefficient > +0.50); if intervention occurs, it could trigger a collective decline in non-US dollar currencies against the yen.
Q1: Why did the yen weaken despite the rise in Japanese bond yields?
Theoretically, rising Japanese bond yields should attract capital inflows, supporting the yen. However, the current logic is that the increase in Japanese bond yields reflects the risk of runaway inflation and increased fiscal pressure (such as the government potentially issuing more bonds for energy subsidies). Furthermore, despite the rising yields, a significant interest rate differential remains between Japanese and US Treasury bonds, a disadvantage that cannot be reversed in the short term, leading to the yen still being considered a funding currency in carry trades.
Q2: Why are the Japanese authorities struggling so much at the 160 mark?
The 160 level is a crucial psychological and political red line. A drop below this level could trigger panic in Japan regarding imported inflation. However, authorities are concerned about the effectiveness of intervention. The current strong dollar is supported by geopolitical tensions and risk aversion stemming from tariff rhetoric. A hasty intervention at this juncture could deplete foreign exchange reserves without reversing the trend. Therefore, current measures focus more on verbal intervention to test the market's bottom line.
Q3: What guidance does the "gap" mentioned in the article have for future trends?
Gaps typically appear during major political events (such as the LDP leadership election last October). In technical analysis, such unfilled gaps are considered "gravity zones." If the Japanese government intervenes forcefully, the exchange rate could fall rapidly in a short period, with the 147.45-149.02 range being a key observation point for short sellers to take profits and for longs to attempt to rebuild their defenses.
Q4: How do crude oil prices affect the yen's exchange rate?
Japan is a country heavily reliant on energy imports. Rising oil prices will widen Japan's trade deficit, increasing companies' rigid demand for US dollars (to pay for oil), thus putting downward pressure on the yen. At the same time, oil prices will push up inflation, forcing Japanese bond yields to rise and further disrupting the stability of the bond market.
Q5: Is the signal displayed by the MACD technical indicator currently reliable?
On the 4-hour chart, the MACD is above the zero line and shows no divergence, indicating that the current upward momentum remains solid. However, this mainly reflects the inertia of the trend. Given the strong expectation of intervention, technical indicators often lag behind sudden policy announcements. Therefore, although the technical picture shows strength, traders need to be wary of a sudden "death cross" in indicators caused by negative policy news.
Sharp Yield Curve Movements: Policy Tightening Expectations Amidst Japanese Bond Sell-Off
The Japanese government bond (JGB) market experienced a significant sell-off today, a move that became a key factor supporting the strengthening of the US dollar against the yen. Influenced by rising expectations of interest rate hikes and persistently high international oil prices , JGB yields rose across the board. The 10-year JGB, in particular, saw the most intense selling pressure.
1. The inherent logic of the policy shift to hawkishness
Market expectations for a Bank of Japan (BoJ) interest rate hike are undergoing a fundamental shift. Despite risks to economic growth, rising energy costs due to geopolitical tensions may force the central bank to adopt a more hawkish stance. This expectation was fully reflected in today's trading: the 5-year JGB yield briefly broke through 1.645%, up 2 basis points from the previous day; the 10-year yield climbed even higher to over 2.205%.
2. Fiscal pressure and energy subsidies
The Takamura administration recently stated that, in order to address the energy crisis, the government plans to utilize oil reserves and provide substantial subsidies, aiming to stabilize the average gasoline price at around 170 yen per liter. However, if international oil prices remain high, the subsidy costs will far exceed the budget, meaning the Japanese government may need to raise funds by issuing more JGBs. The potential increase in supply further pushes up yields, creating a flattened yield curve characteristic of a bear market .
3. Unexpected Signals from the Transitional Bond Auction
It is worth noting that today's 10-year transition bond auction performed well, with a closing yield of 2.195% and a 1 basis point "greenium" premium. Despite the favorable auction results, it failed to alleviate selling pressure in the secondary market, reflecting traders' cautious risk-averse mentality ahead of a policy shift, with funds flowing from longer-term instruments to more liquid spot instruments.
In-depth technical analysis: The ascending channel and resistance levels on the 4-hour chart.
From the 240-minute (4-hour) candlestick chart, the USD/JPY pair is currently in a very clear and strong medium-term uptrend .
Trend Stage Analysis
A stepped upward trend: Since hitting a low of 152.284 on February 12, the exchange rate has steadily risen along a standard yellow ascending channel . This is characterized by continuously rising lows and a successful recovery of the early February high of 157.652, demonstrating extremely strong bullish momentum.
Current position: The latest price of 159.460 is approaching the upper edge of the channel. In the short term, it has been fluctuating slightly in this area. The appearance of the upper shadow line suggests heavy selling pressure in the 159.5-159.7 range.
Interpretation of the MACD indicator
Strong bullish trend: Currently, the DIFF line (0.414) and DEA line (0.375) of the MACD (26, 12, 9) are both running above the 0 axis, establishing the dominance of the bullish market.
No divergence signs: Although the exchange rate hit a new high, the MACD red bars did not show obvious top divergence, which means that the current rise is driven by real buying and there are no obvious signs of momentum exhaustion.
Intervention Risks and Market Maneuvering: The Authorities' "Verbal Barrier"
As the yen approaches the 160 mark, statements from Japanese finance ministry officials have become increasingly assertive. Finance Minister Satsuki Katayama stated today that the government is prepared to take all necessary measures to address exchange rate fluctuations that could impact people's lives, and emphasized maintaining close communication with the United States.
However, there are differing opinions within the market. Some insiders privately believe that, given the current international context, the effectiveness of unilateral intervention may be limited. If geopolitical risks lead to a surge in demand for the US dollar, any intervention to sell off dollars could be quickly swallowed up by the massive market liquidity.
Key technological "gap"
If the authorities intervene directly, there is significant downside potential from a technical perspective. On the daily chart, the emotional volatility triggered by the current regime's rise to power last October left a significant gap between 147.45 and 149.02. Based on the rule of thumb that "gaps must be filled," this range will become the primary target for any pullback as some upward pressure triggers stop-loss orders.
Support and resistance range prediction
Based on the current 4-hour chart channel and market sentiment, the following is a short-term reference range:
Resistance range: 159.70 - 160.50. 159.70 is the upper edge of the current channel and the recent high, while 160.00 is a psychologically significant round number. If it can hold above 159.70, the upside potential will open up further.
Support range: 158.30 - 157.65. 158.30 corresponds to the lower edge of the channel support, while 157.65, as the previous breakout level, has now transformed into an important polarity reversal support.
Key points to watch during trading: Closely monitor whether the 10-year Japanese government bond yield can hold above 2.25%, and the impact of oil price fluctuations on the yen's safe-haven appeal.
Future Trend Outlook
In the short term, the USD/JPY pair remains within a strong upward channel, with no technical reversal signals yet. However, from a fundamental perspective, the yen has entered an "intervention alert zone," and volatility is likely to increase significantly. The market is in an extremely sensitive period; any rumors about the Bank of Japan raising interest rates earlier than expected or specific details about the release of government oil reserves could trigger sharp fluctuations in the exchange rate. It is advisable to pay attention to the high correlation between USD/JPY and EUR/JPY (correlation coefficient > +0.50); if intervention occurs, it could trigger a collective decline in non-US dollar currencies against the yen.
Frequently Asked Questions
Q1: Why did the yen weaken despite the rise in Japanese bond yields?
Theoretically, rising Japanese bond yields should attract capital inflows, supporting the yen. However, the current logic is that the increase in Japanese bond yields reflects the risk of runaway inflation and increased fiscal pressure (such as the government potentially issuing more bonds for energy subsidies). Furthermore, despite the rising yields, a significant interest rate differential remains between Japanese and US Treasury bonds, a disadvantage that cannot be reversed in the short term, leading to the yen still being considered a funding currency in carry trades.
Q2: Why are the Japanese authorities struggling so much at the 160 mark?
The 160 level is a crucial psychological and political red line. A drop below this level could trigger panic in Japan regarding imported inflation. However, authorities are concerned about the effectiveness of intervention. The current strong dollar is supported by geopolitical tensions and risk aversion stemming from tariff rhetoric. A hasty intervention at this juncture could deplete foreign exchange reserves without reversing the trend. Therefore, current measures focus more on verbal intervention to test the market's bottom line.
Q3: What guidance does the "gap" mentioned in the article have for future trends?
Gaps typically appear during major political events (such as the LDP leadership election last October). In technical analysis, such unfilled gaps are considered "gravity zones." If the Japanese government intervenes forcefully, the exchange rate could fall rapidly in a short period, with the 147.45-149.02 range being a key observation point for short sellers to take profits and for longs to attempt to rebuild their defenses.
Q4: How do crude oil prices affect the yen's exchange rate?
Japan is a country heavily reliant on energy imports. Rising oil prices will widen Japan's trade deficit, increasing companies' rigid demand for US dollars (to pay for oil), thus putting downward pressure on the yen. At the same time, oil prices will push up inflation, forcing Japanese bond yields to rise and further disrupting the stability of the bond market.
Q5: Is the signal displayed by the MACD technical indicator currently reliable?
On the 4-hour chart, the MACD is above the zero line and shows no divergence, indicating that the current upward momentum remains solid. However, this mainly reflects the inertia of the trend. Given the strong expectation of intervention, technical indicators often lag behind sudden policy announcements. Therefore, although the technical picture shows strength, traders need to be wary of a sudden "death cross" in indicators caused by negative policy news.
- Risk Warning and Disclaimer
- The market involves risk, and trading may not be suitable for all investors. This article is for reference only and does not constitute personal investment advice, nor does it take into account certain users’ specific investment objectives, financial situation, or other needs. Any investment decisions made based on this information are at your own risk.