Four signs that gold is in the midst of a "perfect storm"
2026-03-23 12:06:06
Four signs indicate that gold is in the midst of a perfect storm.
First, the magnitude of the plunge is the largest in 43 years. The weekly chart for the week ending March 20th closed down 10.44%, marking the largest single-week drop in 43 years (since the end of February 1983). The daily chart shows eight consecutive days of decline, and today could be the ninth consecutive day of decline, setting a new record for the longest losing streak since at least October 2023.
Secondly, the conventional bullish logic has been overturned. There's a famous trading saying, "When the cannons roar, gold flows like water," meaning that the conventional logic is that war is bullish for gold. But this time, with the Middle East engulfed in conflict and Trump and Iran exchanging harsh words, gold prices have plummeted.
Third, the classic dark cloud cover pattern has formed on a major monthly chart for gold. This could signal a formal confirmation of a major correction in gold. Historically, after bearish monthly patterns, such corrections typically last from six months to several years. While history doesn't repeat itself, it often does have striking similarities.
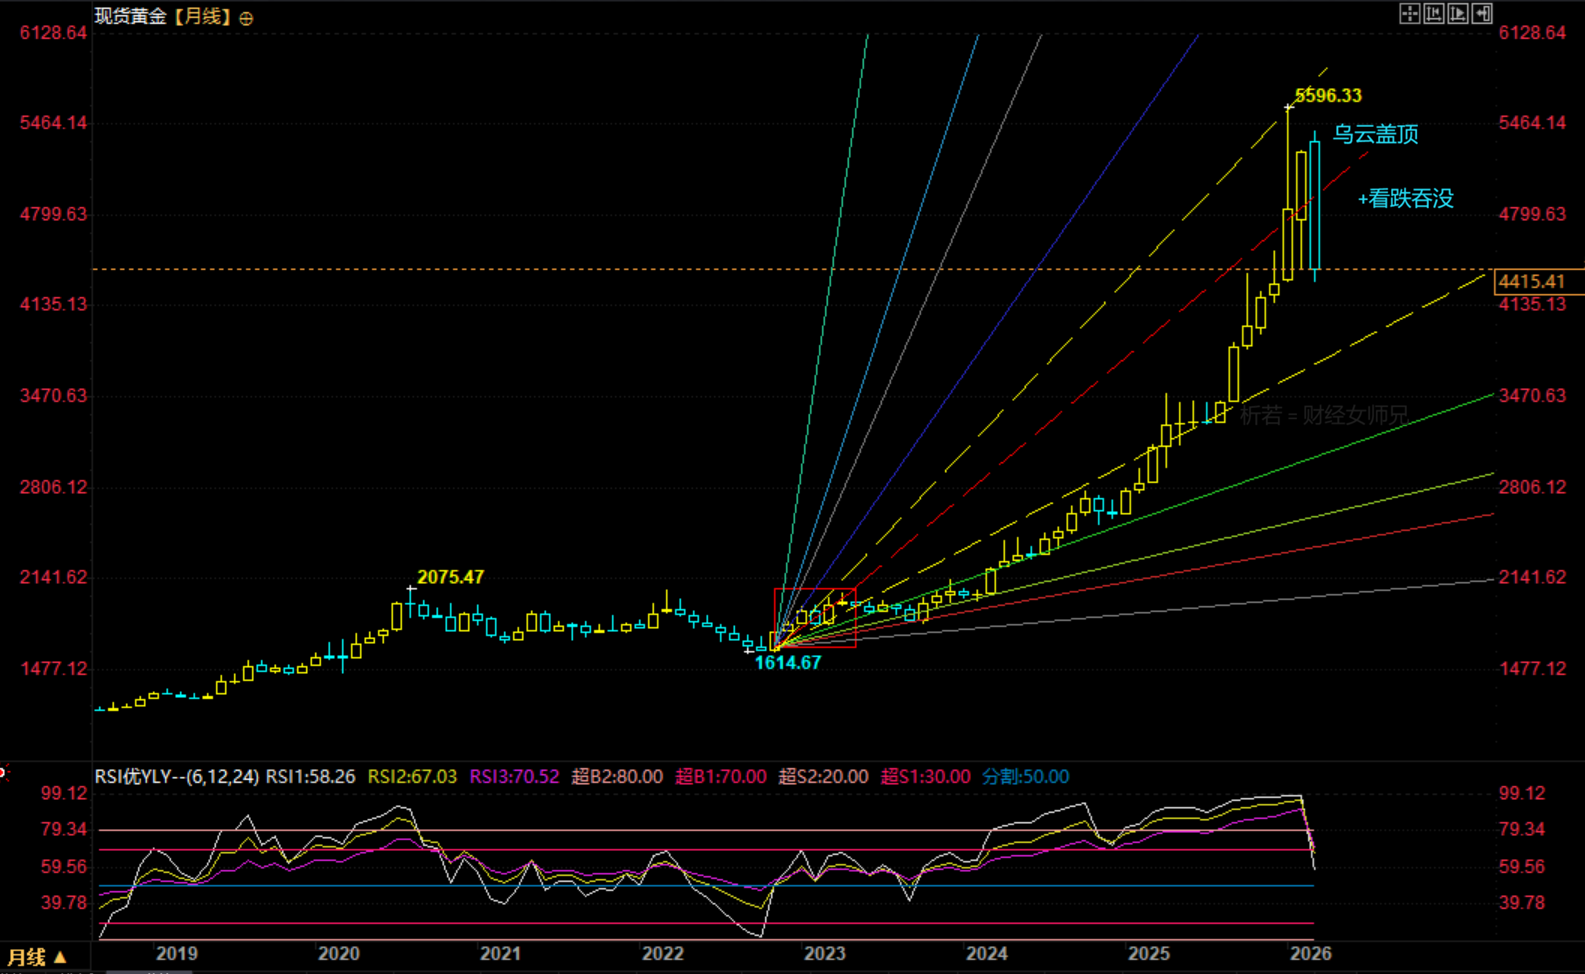
(Chart: Technical analysis of spot gold monthly chart, source: EasyForex)
Fourth, the current situation facing gold is highly similar to the historic crash of late February 1983, when OPEC member countries were forced to liquidate their gold reserves for cash. Recently, there have also been reports that some central banks are selling gold to replenish liquidity.
When gold experiences a once-in-decades plunge; when gold prices fail to rise due to war but instead falter due to liquidity shortages; when large bearish candlesticks at high levels herald the victory of the bears; when central banks, initially bullish on the opportunity to increase their gold holdings, become the main force selling off gold to realize profits—do you sense that gold is at a critical juncture of great change, and that gold prices are caught in a perfect storm?
The term "perfect storm" is a metaphor used in financial markets.
In financial markets, a "perfect storm" refers to the simultaneous eruption and superposition of multiple independent and extreme negative factors within a very short period of time, forming a self-reinforcing negative feedback loop. In other words, multiple key factors resonate together, and their destructive power far exceeds that of a single risk.
The saying goes, "Taiji generates Yin and Yang, Yin and Yang generate the Four Symbols, and the Four Symbols generate the Eight Trigrams." Currently, gold has already generated the "Four Symbols," therefore I will now present the "Eight Trigrams." This is merely theoretical reasoning; please do not take it literally.
Where will this perfect storm blow the price of gold? Probably down from the heavens to earth.
As I have shared before, the overseas order data I have been tracking recently shows that there has been a sell order at 3268, indicating that some people in the market are worried that the price of gold may fall below 3268, triggering their speculative mentality or hedging measures to place sell orders at 3268.
Based on my personal observation, the final surge and acceleration of a major technical rally usually sees a complete reversal during a significant correction. Therefore, considering the current monthly chart trend for gold, we should first focus on the area around 4300, then around 4000, and finally around 3300. Of course, this is a prediction based on a timeframe of several months or even years, not a short-term or near-term market movement. Please remember this.
The financial market is like a battlefield, full of deception and reality, with reality hidden within deception and deception hidden within reality.
With the same market conditions and the same set of candlestick charts, what you see and how many opportunities you can seize depends entirely on your understanding and level of insight, and has little to do with other people's analysis. [Wishing you successful investing.]
This article is an original work by FX678 analyst Xi Ruo and is copyrighted. It is for reference only and should not be used as a basis for trading.
First, the magnitude of the plunge is the largest in 43 years. The weekly chart for the week ending March 20th closed down 10.44%, marking the largest single-week drop in 43 years (since the end of February 1983). The daily chart shows eight consecutive days of decline, and today could be the ninth consecutive day of decline, setting a new record for the longest losing streak since at least October 2023.
Secondly, the conventional bullish logic has been overturned. There's a famous trading saying, "When the cannons roar, gold flows like water," meaning that the conventional logic is that war is bullish for gold. But this time, with the Middle East engulfed in conflict and Trump and Iran exchanging harsh words, gold prices have plummeted.
Third, the classic dark cloud cover pattern has formed on a major monthly chart for gold. This could signal a formal confirmation of a major correction in gold. Historically, after bearish monthly patterns, such corrections typically last from six months to several years. While history doesn't repeat itself, it often does have striking similarities.
(Chart: Technical analysis of spot gold monthly chart, source: EasyForex)
Fourth, the current situation facing gold is highly similar to the historic crash of late February 1983, when OPEC member countries were forced to liquidate their gold reserves for cash. Recently, there have also been reports that some central banks are selling gold to replenish liquidity.
When gold experiences a once-in-decades plunge; when gold prices fail to rise due to war but instead falter due to liquidity shortages; when large bearish candlesticks at high levels herald the victory of the bears; when central banks, initially bullish on the opportunity to increase their gold holdings, become the main force selling off gold to realize profits—do you sense that gold is at a critical juncture of great change, and that gold prices are caught in a perfect storm?
The term "perfect storm" is a metaphor used in financial markets.
In financial markets, a "perfect storm" refers to the simultaneous eruption and superposition of multiple independent and extreme negative factors within a very short period of time, forming a self-reinforcing negative feedback loop. In other words, multiple key factors resonate together, and their destructive power far exceeds that of a single risk.
The saying goes, "Taiji generates Yin and Yang, Yin and Yang generate the Four Symbols, and the Four Symbols generate the Eight Trigrams." Currently, gold has already generated the "Four Symbols," therefore I will now present the "Eight Trigrams." This is merely theoretical reasoning; please do not take it literally.
Where will this perfect storm blow the price of gold? Probably down from the heavens to earth.
As I have shared before, the overseas order data I have been tracking recently shows that there has been a sell order at 3268, indicating that some people in the market are worried that the price of gold may fall below 3268, triggering their speculative mentality or hedging measures to place sell orders at 3268.
Based on my personal observation, the final surge and acceleration of a major technical rally usually sees a complete reversal during a significant correction. Therefore, considering the current monthly chart trend for gold, we should first focus on the area around 4300, then around 4000, and finally around 3300. Of course, this is a prediction based on a timeframe of several months or even years, not a short-term or near-term market movement. Please remember this.
The financial market is like a battlefield, full of deception and reality, with reality hidden within deception and deception hidden within reality.
With the same market conditions and the same set of candlestick charts, what you see and how many opportunities you can seize depends entirely on your understanding and level of insight, and has little to do with other people's analysis. [Wishing you successful investing.]
This article is an original work by FX678 analyst Xi Ruo and is copyrighted. It is for reference only and should not be used as a basis for trading.
- Risk Warning and Disclaimer
- The market involves risk, and trading may not be suitable for all investors. This article is for reference only and does not constitute personal investment advice, nor does it take into account certain users’ specific investment objectives, financial situation, or other needs. Any investment decisions made based on this information are at your own risk.