Spot Gold Technical Analysis: Bulls and Bears Battle at the Bollinger Middle Band
2026-03-26 20:07:34
The current gold price movement exhibits a double-nested descending channel structure, which is the core framework for understanding the medium-term trend.

The green descending channel is the core trend line dominating the medium-term trend, originating from the historical high of 5596 at the end of January. During the decline in gold prices from this high, this broad descending channel was drawn by connecting successively lower highs and lows, fully covering the medium-term correction since the beginning of the year. Currently, the middle line of this channel is around 4675, while the upper and lower lines have moved downwards over time, forming a clear medium-term downward pressure zone. On March 20th, gold prices effectively broke below the middle line of the channel, directly confirming the weakening of the medium-term trend. To regain strength, gold must firmly establish itself and break through the key level of 4675.
The red secondary descending channel, nested within the green main channel, is an accelerated downward substructure formed after the local high of 5419 in early March. Compared to the green channel, its slope is steeper, reflecting the intensified decline. By connecting the highs and lows during this sharp drop, the current channel's middle line is located in the 4550-4560 range, with secondary resistance near 4600 and secondary support pointing to the 4100-4050 range. After gold prices broke below the middle line of this secondary channel on March 20th, yesterday's rebound attempt encountered resistance near the middle line and fell back, indicating that short-term bearish forces still dominate, and the bullish counterattack has not yet succeeded.
Key technical levels and the focus of the bull-bear battle
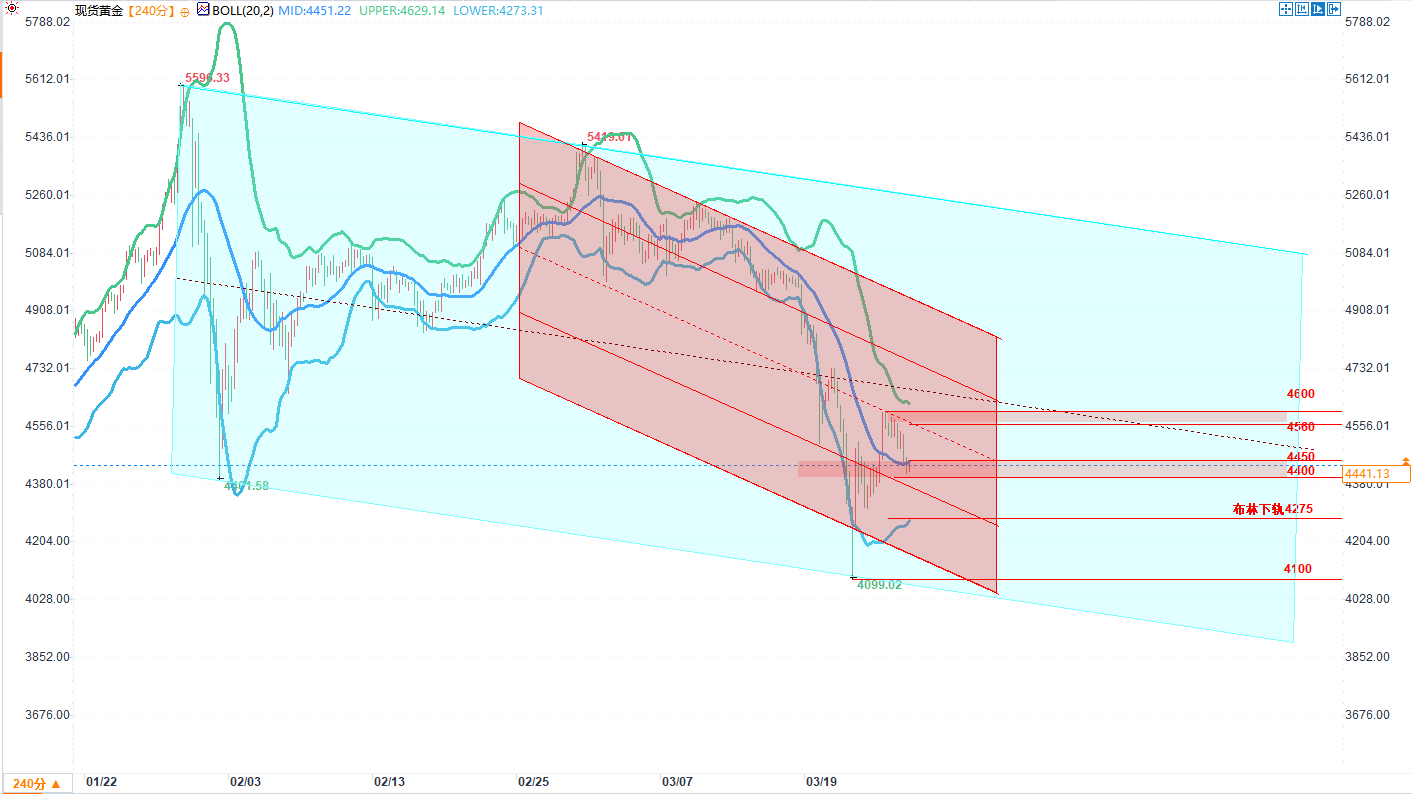
(4-hour chart of spot gold source: EasyForex)
The current market's battle between bulls and bears is highly concentrated around the Bollinger Band middle line (20-period moving average) at 4450, which is a key watershed for the short-term trend. From a technical perspective, the price has been oscillating closely around the Bollinger Band middle line, with bulls and bears repeatedly fighting for control: if it can effectively hold and break through 4450, the bulls will gain upward momentum; if it falls below this level, it means that the bears have gained the upper hand in the short term, and the downside potential will be opened up.
Below 4450, the secondary support level of 4400 within the red descending channel forms the first line of defense. This level resonates with the key support below the Bollinger Middle Band, serving as an important buffer zone for the short-term decline. If 4450 is breached, gold prices will likely test 4400. A decisive break below this level would confirm the continuation of the short-term downtrend.
If the market weakens further, it will face short-term extreme support at the lower Bollinger Band at 4275, which is an important technical buffer. If 4275 is also broken, it will enter a medium-term breakdown phase, ultimately testing the strong support zone of 4100-4050, where the previous low of 4099.02 coincides with the lower band of the double channel. This is the last line of defense for the current medium-term trend, and once it is breached, the decline will deepen further.
Trend deduction and trading logic
From an overall structural perspective, gold prices are currently in a short-term weak recovery phase within a medium-term downtrend. The downward pressure from the double descending channels is evident, and the bulls have not yet formed an effective counterattack force.
Bullish recovery scenario: If the price stabilizes above 4450 and successfully breaks through the middle line of the red secondary channel at 4550-4560, it will open up upward recovery space. The next target will be to challenge the middle line of the green major channel at 4675, which is a key signal of a strengthening medium-term trend.
Short-term weakening scenario: If the price breaks below 4450 and then below 4400, the gold price will test the lower Bollinger Band at 4275. In this scenario, the bears will dominate the market in the short term, and the recovery will fail.
Mid-term breakdown scenario: If 4275 is broken, the gold price will move towards the 4100-4050 range, and the mid-term downtrend will continue further. We need to be wary of a deeper correction.
Overall, the core contradiction in the current market lies in the medium-term resistance of the double descending channel and the struggle between bulls and bears at the short-term Bollinger middle line. The 4450-4400 range is a key watershed for judging the subsequent trend. Investors need to pay close attention to the price's breakout of these key levels in order to formulate corresponding trading strategies.
At 20:02 Beijing time on Thursday (March 26), spot gold was trading at $4,417.38 per ounce, down 1.98%.
The green descending channel is the core trend line dominating the medium-term trend, originating from the historical high of 5596 at the end of January. During the decline in gold prices from this high, this broad descending channel was drawn by connecting successively lower highs and lows, fully covering the medium-term correction since the beginning of the year. Currently, the middle line of this channel is around 4675, while the upper and lower lines have moved downwards over time, forming a clear medium-term downward pressure zone. On March 20th, gold prices effectively broke below the middle line of the channel, directly confirming the weakening of the medium-term trend. To regain strength, gold must firmly establish itself and break through the key level of 4675.
The red secondary descending channel, nested within the green main channel, is an accelerated downward substructure formed after the local high of 5419 in early March. Compared to the green channel, its slope is steeper, reflecting the intensified decline. By connecting the highs and lows during this sharp drop, the current channel's middle line is located in the 4550-4560 range, with secondary resistance near 4600 and secondary support pointing to the 4100-4050 range. After gold prices broke below the middle line of this secondary channel on March 20th, yesterday's rebound attempt encountered resistance near the middle line and fell back, indicating that short-term bearish forces still dominate, and the bullish counterattack has not yet succeeded.
Key technical levels and the focus of the bull-bear battle
(4-hour chart of spot gold source: EasyForex)
The current market's battle between bulls and bears is highly concentrated around the Bollinger Band middle line (20-period moving average) at 4450, which is a key watershed for the short-term trend. From a technical perspective, the price has been oscillating closely around the Bollinger Band middle line, with bulls and bears repeatedly fighting for control: if it can effectively hold and break through 4450, the bulls will gain upward momentum; if it falls below this level, it means that the bears have gained the upper hand in the short term, and the downside potential will be opened up.
Below 4450, the secondary support level of 4400 within the red descending channel forms the first line of defense. This level resonates with the key support below the Bollinger Middle Band, serving as an important buffer zone for the short-term decline. If 4450 is breached, gold prices will likely test 4400. A decisive break below this level would confirm the continuation of the short-term downtrend.
If the market weakens further, it will face short-term extreme support at the lower Bollinger Band at 4275, which is an important technical buffer. If 4275 is also broken, it will enter a medium-term breakdown phase, ultimately testing the strong support zone of 4100-4050, where the previous low of 4099.02 coincides with the lower band of the double channel. This is the last line of defense for the current medium-term trend, and once it is breached, the decline will deepen further.
Trend deduction and trading logic
From an overall structural perspective, gold prices are currently in a short-term weak recovery phase within a medium-term downtrend. The downward pressure from the double descending channels is evident, and the bulls have not yet formed an effective counterattack force.
Bullish recovery scenario: If the price stabilizes above 4450 and successfully breaks through the middle line of the red secondary channel at 4550-4560, it will open up upward recovery space. The next target will be to challenge the middle line of the green major channel at 4675, which is a key signal of a strengthening medium-term trend.
Short-term weakening scenario: If the price breaks below 4450 and then below 4400, the gold price will test the lower Bollinger Band at 4275. In this scenario, the bears will dominate the market in the short term, and the recovery will fail.
Mid-term breakdown scenario: If 4275 is broken, the gold price will move towards the 4100-4050 range, and the mid-term downtrend will continue further. We need to be wary of a deeper correction.
Overall, the core contradiction in the current market lies in the medium-term resistance of the double descending channel and the struggle between bulls and bears at the short-term Bollinger middle line. The 4450-4400 range is a key watershed for judging the subsequent trend. Investors need to pay close attention to the price's breakout of these key levels in order to formulate corresponding trading strategies.
At 20:02 Beijing time on Thursday (March 26), spot gold was trading at $4,417.38 per ounce, down 1.98%.
- Risk Warning and Disclaimer
- The market involves risk, and trading may not be suitable for all investors. This article is for reference only and does not constitute personal investment advice, nor does it take into account certain users’ specific investment objectives, financial situation, or other needs. Any investment decisions made based on this information are at your own risk.