Those who understand Oman and the Urals already know where the oil market is headed next.
2026-03-26 21:08:07
On Thursday (March 26), the global crude oil market exhibited a multi-dimensional game amidst dramatic fluctuations. As geopolitical situations evolved, sentiment shifted repeatedly between the risk of supply disruptions and inflationary pressures. Market data showed that Brent and WTI crudes, after extreme rallies, entered a period of high-level consolidation and restructuring. Oil prices have risen by over 50% this month, severely impacting safe-haven assets such as gold, and market focus has shifted from analyzing single price fluctuations to analyzing price spread structures.

The macroeconomic backdrop is extremely complex: soaring energy costs have led to market concerns about further monetary policy tightening; the IEA released 400 million barrels of emergency reserves in an attempt to offset the shortfall. In this context, price spreads are no longer just dry numbers, but rather a "weathervane" for global physical trade flows and regional supply tightness.
Brent and WTI have clearly decoupled, with the price spread widening to over $12. European energy premiums far exceed those of North America, and the MACD for US crude oil has confirmed a death cross with expanding green bars, indicating significant pressure on demand due to tariff rhetoric. However, the truly chilling anomaly occurred in the deep waters of the physical trading market.
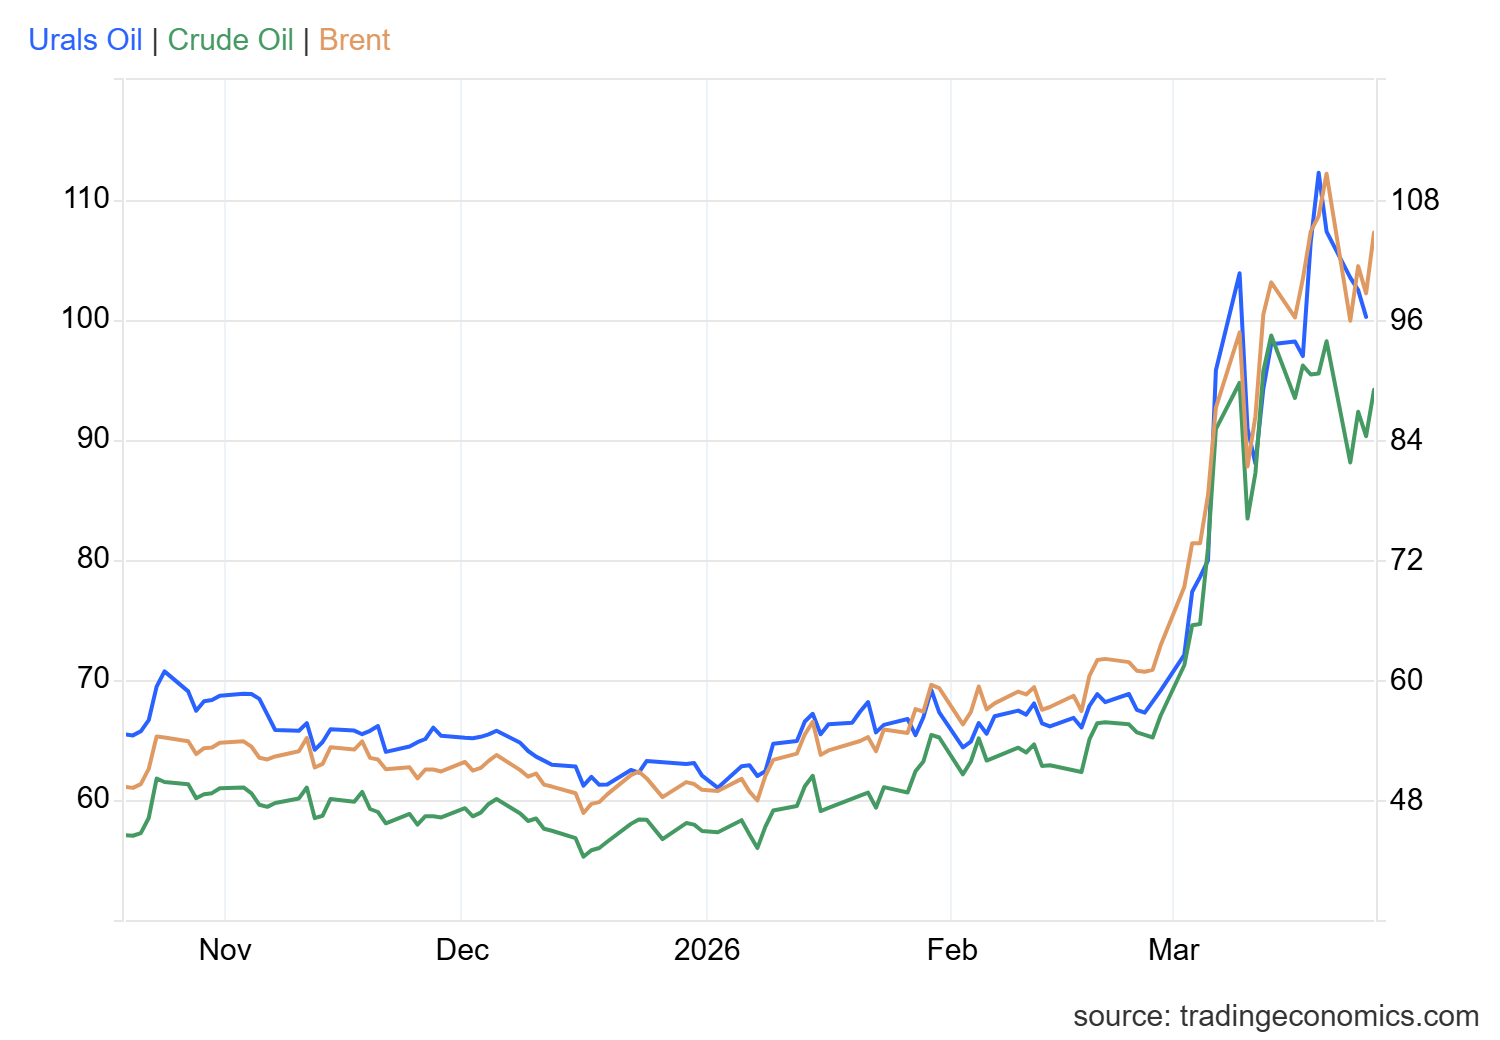
Urals Crude Oil: A Structural Shift in the Global Pricing System <br/>A disruptive phenomenon deserves attention: Urals crude oil is emerging from its long-standing discount to achieve parity or even a premium with Brent crude. While its price fell to $96.31 on March 25th, the cumulative increase of 66.51% over the past month reveals a deep structural shortage in the global supply of medium and heavy crude oil.
This is no longer a simple short-term fluctuation, but a logical restructuring of physical trade flows. Amidst the interplay between European refineries' eagerness to find substitutes and Russia's flexible adjustments to export flows, the scarcity in the physical market has directly driven up its benchmark premium. This "supply is king" situation reflects that Urals crude is redefining its pricing power in the global energy landscape, becoming a solid physical foundation supporting Brent's high prices.
Oman Crude Oil: Divergent Expectations Amid Near-to-Far-Month Spreads <br/>Meanwhile, Oman crude oil exhibited a distinctly different dimension. On the 26th, the May contract for Oman fell 13.80% to $112. This move was not an isolated plunge, but rather a result of sharp fluctuations in the near-to-far-month spread.
This deep premium structure (near-month high, far-month low) actually reflects complex market psychology: near-month physical buying remains highly strained due to geopolitical concerns, while the decline in far-month contracts suggests a potential market expectation of a recovery in future supply. This tug-of-war across timeframes is more like the market pricing in the "post-conflict era." For traders, the movement of Oman crude oil is not a simple reversal signal, but rather a reminder that we need to find a more precise balance between the "current shortage" and the "future return to normalcy."
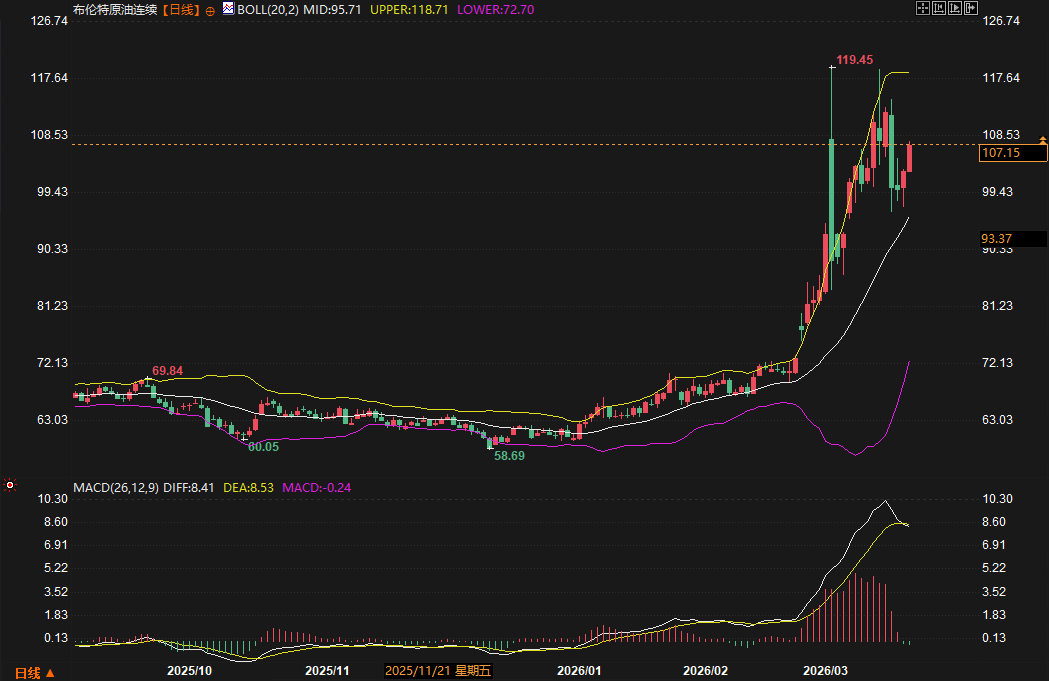
Brent crude oil retreated after touching $119.45, forming a consolidation range between $100 and $110. Short-term resistance is located at $108.53 (the intersection of the gap and the upper Bollinger Band). If a breakout with significant volume fails, the price will seek support at the middle Bollinger Band at $93.37.
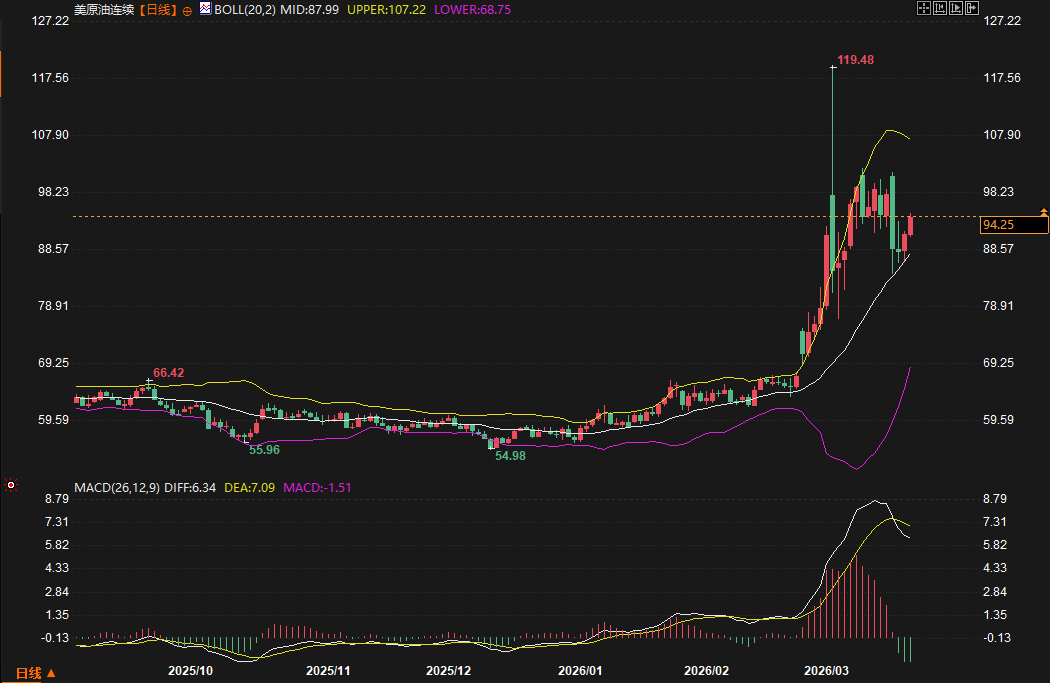
US crude oil prices showed further weakness, trading below $98.23. The MACD formed a death cross and diverged downwards, while the RSI fell back to the 50 midline, indicating accumulating bearish momentum. The "British strong, US weak" pattern, coupled with geopolitical uncertainties, makes the $85-$90 range the last line of defense for the bulls. However, caution is advised: if Oman crude oil, a physical bellwether, breaks through this level first, the seemingly solid support zone may just be an illusion built on quicksand.
Pricing logic has shifted from supply and demand statements to a trade-off between "political premium" and "macroeconomic costs." Russia emphasizes that the Urals premium aims to maintain fiscal resilience; the IEA, on the other hand, is attempting to mitigate inflationary shocks by reducing its recommendations.
Looking ahead, although currently in a pullback phase, low inventory levels and the challenges of energy transition under high interest rates limit the potential for a sharp decline. The key variable lies in the duration of the situation in Iran. If the diplomatic stalemate continues, Brent crude may begin a second dip after testing support. Investors must closely monitor the narrowing of the price spread: once the Brent-WTI spread returns to within $8 and the Urals premium disappears, it often indicates a complete clearing of sentiment, and the true bottoming process will begin.
1. What signal does it send that Urals crude oil has shifted to parity or even a premium with Brent crude?
This marks the beginning of a "structural scarcity" phase in the global supply of medium and heavy crude oil. Traditional discount logic is based on the premise of ample supply and stable trade flows. The current price parity reflects that, against the backdrop of European refineries urgently seeking alternative supplies and Russia re-anchoring its export radius, the pricing power in the physical market has shifted towards the supply side. This is no longer a short-term impulsive fluctuation, but rather strong support from the physical market for the Brent benchmark price, forming a solid bottom for high oil prices.
2. Why is there a significant discount in the far-month contract for Oman crude oil?
This reflects a typical "time premium collapse" in the market. Near-month contracts, supported by geopolitical tensions and immediate delivery demand, are overvalued; while far-month contracts have fallen sharply, indicating a rational market expectation of a recovery in forward supply and a return to normal demand. This dramatic backwardation structure is evidence of tight spot supply, but it also reminds traders that current high prices lack resonance with forward fundamentals, and the market is in a period of extreme tug-of-war between "near-term strength and far-term weakness."
3. IEA releases 400 million barrels of emergency reserves: a trend reversal or short-term disruption?
In terms of scale, while 400 million barrels cannot reverse the long-term balance of global supply and demand, it is an important signal of "marginal policy intervention." It can effectively smooth out the extreme volatility triggered by panic. Traders should view it as a kind of "resistance level": when prices touch key resistance levels at high levels, the psychological pressure of reserve releases often induces short-term bulls to take profits, thereby exacerbating the frequency of high-level fluctuations.
4. Why is the current "strong Brent, weak WTI" (widening Brent-WTI price spread) situation not to be ignored?
A price spread exceeding $12 represents an extreme manifestation of "regional supply mismatch." Brent crude is directly pressured by the eye of the geopolitical storm, resulting in a higher premium; while WTI crude is constrained by expectations of high domestic inventories and trade protectionist concerns stemming from future tariff rhetoric, leading to a relatively restrained price movement. This divergence indicates that the global crude oil market is in a state of "fragmented pricing," and the risks of cross-commodity arbitrage trading are rising exponentially.
5. Faced with the coexistence of a Ural premium and an Oman discount, how should traders find an anchor point?
This requires traders to shift from "price speculation" to "basis speculation." The premium of the Ural futures contract determines the downside potential (support line), while the discount of the Omani futures contract sets the upside ceiling (resistance level). When the price difference structure of these two contracts begins to correct towards the mean (the premium narrows and the discount converges), it often indicates that market sentiment has cleared, and that is when the true opportunity for a trend to be chosen arises.
The macroeconomic backdrop is extremely complex: soaring energy costs have led to market concerns about further monetary policy tightening; the IEA released 400 million barrels of emergency reserves in an attempt to offset the shortfall. In this context, price spreads are no longer just dry numbers, but rather a "weathervane" for global physical trade flows and regional supply tightness.
A Multi-Dimensional Perspective on Price Spreads: The Logical Breakdown Between the Ural Premium and the Collapse of Oman
Brent and WTI have clearly decoupled, with the price spread widening to over $12. European energy premiums far exceed those of North America, and the MACD for US crude oil has confirmed a death cross with expanding green bars, indicating significant pressure on demand due to tariff rhetoric. However, the truly chilling anomaly occurred in the deep waters of the physical trading market.
Urals Crude Oil: A Structural Shift in the Global Pricing System <br/>A disruptive phenomenon deserves attention: Urals crude oil is emerging from its long-standing discount to achieve parity or even a premium with Brent crude. While its price fell to $96.31 on March 25th, the cumulative increase of 66.51% over the past month reveals a deep structural shortage in the global supply of medium and heavy crude oil.
This is no longer a simple short-term fluctuation, but a logical restructuring of physical trade flows. Amidst the interplay between European refineries' eagerness to find substitutes and Russia's flexible adjustments to export flows, the scarcity in the physical market has directly driven up its benchmark premium. This "supply is king" situation reflects that Urals crude is redefining its pricing power in the global energy landscape, becoming a solid physical foundation supporting Brent's high prices.
Oman Crude Oil: Divergent Expectations Amid Near-to-Far-Month Spreads <br/>Meanwhile, Oman crude oil exhibited a distinctly different dimension. On the 26th, the May contract for Oman fell 13.80% to $112. This move was not an isolated plunge, but rather a result of sharp fluctuations in the near-to-far-month spread.
This deep premium structure (near-month high, far-month low) actually reflects complex market psychology: near-month physical buying remains highly strained due to geopolitical concerns, while the decline in far-month contracts suggests a potential market expectation of a recovery in future supply. This tug-of-war across timeframes is more like the market pricing in the "post-conflict era." For traders, the movement of Oman crude oil is not a simple reversal signal, but rather a reminder that we need to find a more precise balance between the "current shortage" and the "future return to normalcy."
Technical and fundamental factors intertwine: a range-bound analysis of defenses and pitfalls.
Brent crude oil retreated after touching $119.45, forming a consolidation range between $100 and $110. Short-term resistance is located at $108.53 (the intersection of the gap and the upper Bollinger Band). If a breakout with significant volume fails, the price will seek support at the middle Bollinger Band at $93.37.
US crude oil prices showed further weakness, trading below $98.23. The MACD formed a death cross and diverged downwards, while the RSI fell back to the 50 midline, indicating accumulating bearish momentum. The "British strong, US weak" pattern, coupled with geopolitical uncertainties, makes the $85-$90 range the last line of defense for the bulls. However, caution is advised: if Oman crude oil, a physical bellwether, breaks through this level first, the seemingly solid support zone may just be an illusion built on quicksand.
Future Outlook Under Geopolitical and Policy Game
Pricing logic has shifted from supply and demand statements to a trade-off between "political premium" and "macroeconomic costs." Russia emphasizes that the Urals premium aims to maintain fiscal resilience; the IEA, on the other hand, is attempting to mitigate inflationary shocks by reducing its recommendations.
Looking ahead, although currently in a pullback phase, low inventory levels and the challenges of energy transition under high interest rates limit the potential for a sharp decline. The key variable lies in the duration of the situation in Iran. If the diplomatic stalemate continues, Brent crude may begin a second dip after testing support. Investors must closely monitor the narrowing of the price spread: once the Brent-WTI spread returns to within $8 and the Urals premium disappears, it often indicates a complete clearing of sentiment, and the true bottoming process will begin.
[In-depth Q&A on Core Logic]
1. What signal does it send that Urals crude oil has shifted to parity or even a premium with Brent crude?
This marks the beginning of a "structural scarcity" phase in the global supply of medium and heavy crude oil. Traditional discount logic is based on the premise of ample supply and stable trade flows. The current price parity reflects that, against the backdrop of European refineries urgently seeking alternative supplies and Russia re-anchoring its export radius, the pricing power in the physical market has shifted towards the supply side. This is no longer a short-term impulsive fluctuation, but rather strong support from the physical market for the Brent benchmark price, forming a solid bottom for high oil prices.
2. Why is there a significant discount in the far-month contract for Oman crude oil?
This reflects a typical "time premium collapse" in the market. Near-month contracts, supported by geopolitical tensions and immediate delivery demand, are overvalued; while far-month contracts have fallen sharply, indicating a rational market expectation of a recovery in forward supply and a return to normal demand. This dramatic backwardation structure is evidence of tight spot supply, but it also reminds traders that current high prices lack resonance with forward fundamentals, and the market is in a period of extreme tug-of-war between "near-term strength and far-term weakness."
3. IEA releases 400 million barrels of emergency reserves: a trend reversal or short-term disruption?
In terms of scale, while 400 million barrels cannot reverse the long-term balance of global supply and demand, it is an important signal of "marginal policy intervention." It can effectively smooth out the extreme volatility triggered by panic. Traders should view it as a kind of "resistance level": when prices touch key resistance levels at high levels, the psychological pressure of reserve releases often induces short-term bulls to take profits, thereby exacerbating the frequency of high-level fluctuations.
4. Why is the current "strong Brent, weak WTI" (widening Brent-WTI price spread) situation not to be ignored?
A price spread exceeding $12 represents an extreme manifestation of "regional supply mismatch." Brent crude is directly pressured by the eye of the geopolitical storm, resulting in a higher premium; while WTI crude is constrained by expectations of high domestic inventories and trade protectionist concerns stemming from future tariff rhetoric, leading to a relatively restrained price movement. This divergence indicates that the global crude oil market is in a state of "fragmented pricing," and the risks of cross-commodity arbitrage trading are rising exponentially.
5. Faced with the coexistence of a Ural premium and an Oman discount, how should traders find an anchor point?
This requires traders to shift from "price speculation" to "basis speculation." The premium of the Ural futures contract determines the downside potential (support line), while the discount of the Omani futures contract sets the upside ceiling (resistance level). When the price difference structure of these two contracts begins to correct towards the mean (the premium narrows and the discount converges), it often indicates that market sentiment has cleared, and that is when the true opportunity for a trend to be chosen arises.
- Risk Warning and Disclaimer
- The market involves risk, and trading may not be suitable for all investors. This article is for reference only and does not constitute personal investment advice, nor does it take into account certain users’ specific investment objectives, financial situation, or other needs. Any investment decisions made based on this information are at your own risk.