When disagreements become the main theme: Is gold at the "peak of a generation" or the "start of a new cycle"?
2026-04-06 18:38:06
In early April 2026, the global gold market was at a delicate and crucial juncture. After a near-year-long, one-sided upward surge with few significant pullbacks in 2025, gold prices plummeted by over 20% from their historical high of approximately $5,594 per ounce at the end of January, briefly entering what technically constitutes a "bear market" (a drop of more than 20% from recent highs). However, unlike the sudden collapses common in traditional bear markets, this correction did not escalate into panic selling. Prices repeatedly found strong support around the $4,400-$4,500 level and are currently maintaining a narrow range of fluctuation around $4,700, with significantly reduced volatility and daily swings mostly within 1%. This stalemate—"falling without breaking through, rising but encountering resistance"—quickly eroded the almost unanimous bullish expectations of the past year. Market sentiment has diverged into two camps: one believes gold has entered the top of this supercycle and is only at the beginning of a long downward trend; the other firmly believes this is merely a healthy correction within an epic rally, and the long-term bull market trend remains unchanged. This disagreement is no longer just noise, but has become the dominant narrative in the market.

The underlying logic hasn't disappeared, but pricing has started to "malfunction."
Looking back at the gold bull market in 2025, its upward path was once so clear as to be almost textbook clear: repeated escalation of geopolitical conflicts in the Middle East boosted safe-haven sentiment, the Federal Reserve's interest rate cut cycle, which began at the end of 2024, continued to strengthen expectations of declining real interest rates, coupled with the allocation needs of emerging market central banks and sovereign wealth funds under the global wave of de-dollarization, the three forces resonated perfectly, pushing gold prices from around $3,200 at the end of 2024 all the way up to above $5,500.
Entering 2026, these three core logics did not seem to have weakened significantly on the surface—the situation in the Middle East remained tense, the Federal Reserve remained on an easing track, and the internationalization of non-US currencies such as the RMB and rupee accelerated—but the market's pricing reaction underwent a qualitative change.
The most typical example is the marginal failure of the "safe-haven attribute." Take the recent escalation of the Middle East conflict as an example. According to traditional logic, the intensification of conflict should directly stimulate safe-haven buying of gold, with prices expected to surge by at least 10%. However, in reality, gold prices experienced a phase of correction during the most intense period of the conflict. The underlying transmission chain has quietly shifted: geopolitical conflicts first push up energy prices such as crude oil, leading to repeated increases in global inflation expectations; inflation stickiness, in turn, supports a stronger US dollar index (DXY once rebounded above 108); a stronger dollar, coupled with increased volatility in global risk assets, forces leveraged funds and macro hedge funds to deleverage simultaneously. As a "non-interest-bearing asset," gold is passively pressured in this chain of tightening liquidity and dollar dominance. The traditional one-way logic of "geopolitics → safe-haven → rising gold prices" has been partially replaced by a complex feedback loop of "geopolitics → energy inflation → stronger dollar → tightening liquidity → pressure on gold." The safe-haven attribute has not disappeared; its transmission efficiency has simply been significantly diluted by macroeconomic and financial conditions.
The Fed's path is unclear, and the pricing anchor has become blurred.
While the shift in the hedging logic may be considered a marginal adjustment, the uncertainty surrounding monetary policy has directly shaken the core pricing foundation of gold—real interest rates. Gold has long exhibited a high degree of negative correlation with the real yield of 10-year TIPS (the correlation coefficient has consistently remained above -0.7). However, since the beginning of 2026, market expectations regarding the path of real interest rates have become severely divided.
On the one hand, US economic data showed unexpected resilience: the annualized quarter-on-quarter GDP growth rate in the first quarter of 2026 remained above 2.5%, non-farm payrolls continued to exceed expectations, and consumer spending did not show a significant decline. This has led to a continuous postponement of expectations for Federal Reserve rate cuts, with the market's implied cumulative number of rate cuts in 2026 compressed from 4-5 at the beginning of the year to around 2.
On the other hand, high and volatile energy prices and localized supply chain bottlenecks have kept core PCE inflation within a sticky range of 2.8%-3.2%, limiting the downside potential for real interest rates. As a result, traders are unable to form a clear "bullish consensus on gold" (significant interest rate cuts + low real interest rates) or lack sufficient "negative confirmation" (hard landing of the economy + aggressive easing).
With the pricing anchor unclear, gold's trending unilateral movement in 2025 naturally shifted to range-bound trading in 2026. The volatility index (GVZ) has fallen from its peak of 25 in 2025 to the current 12-15, and the implied volatility curve for options has also shown a significant flattening, reflecting a substantial decline in the market's willingness to make directional bets.
While many institutions are bullish, their differing opinions are widening.
Market divergences are particularly evident in research reports from top institutions. Goldman Sachs and UBS, for example, both maintain a long-term bullish stance, but their starting points, pricing frameworks, and target price paths differ significantly.
Goldman Sachs' analytical framework focuses more on the "current supply and demand structure." Its latest report points out that emerging market central banks (represented by China, India, Turkey, and Poland) will net purchases of gold exceeding 1,100 tons in 2025, with this momentum continuing into the first quarter of 2026. Meanwhile, global pension funds and sovereign wealth funds are increasing their gold allocation from the historical average of 1.5% to 2.5%-3% in their asset allocations, providing a stable "floor." Goldman Sachs believes this demand is more of a "defensive allocation" rather than an "offensive chasing of the rally," therefore its forecast for gold prices leans towards a moderate upward revision—a target price of $5,200-$5,400 by the end of 2026 under the baseline scenario, emphasizing a "slow bull" market.
UBS's perspective leans more towards "macroeconomic cycles and systemic risks." Their report analyzes gold within the framework of a longer-term monetary system restructuring and global debt expansion: the global public debt-to-GDP ratio is approaching 120%, fiscal space in major economies continues to shrink, and geopolitical conflicts are viewed as structural rather than cyclical variables. Within this framework, the trend of interest rate cuts, the marginal weakening of the US dollar's credit, and demand for safe-haven assets are seen as persistent bullish factors. UBS is therefore more aggressive on the upside potential, maintaining its target range of $5,500-$6,000 for 2026, believing that the current fluctuations around $4,700 are merely a "bull market consolidation platform" rather than a trend reversal.
Similar disagreements are also reflected in other institutions: JPMorgan Chase leans more towards Goldman Sachs' supply and demand-based logic, with a relatively conservative target price; Societe Generale, on the other hand, is closer to UBS, emphasizing a "debt-currency-gold" triad framework. This divergence in institutional views is directly reflected in the positioning data: CFTC gold futures net long positions have fallen from nearly 300,000 contracts at their 2025 high to around 120,000 contracts currently, but have not turned net short, indicating that both bulls and bears are waiting for a clearer catalyst.
Behind the disagreement lies a competition between two pricing methods.
At a deeper level, this institutional disagreement is not simply a debate over whether the target price is high or low, but rather a parallel game between two completely different pricing paradigms.
The first approach is "pricing based on actual supply and demand and capital flows": it emphasizes quantifiable variables such as current physical buying, central bank gold purchases, ETF holdings, and mineral supply (global mine production is projected to increase by only 1.2% in 2025). The core logic is that "prices are determined by marginal buying." This paradigm performed exceptionally well in 2025, when trends were clear and liquidity was ample, but its predictive ability significantly declined after entering the period of macroeconomic uncertainty in 2026.
The second approach is "macrocycle and risk structure pricing": focusing on long-term uncertainties such as debt ceilings, fragmentation of the monetary system, and the probability distribution of geopolitical black swan events. The core logic is that "valuation is determined by systemic risk premium." This paradigm is better at capturing trend reversals, but it is easily affected by liquidity shocks in the short term.
When the market is in a clear trend phase, both factors reinforce each other, forming a positive feedback loop. However, once it enters a transitional phase (as is the case now), the differences are rapidly amplified, manifesting as high-frequency price fluctuations and fluctuating expectations. The $4400-$4500 range is becoming the focal point of this competition.
Why has the $4400-$4500 price range become a focal point of disagreement?
This price range is by no means accidental.
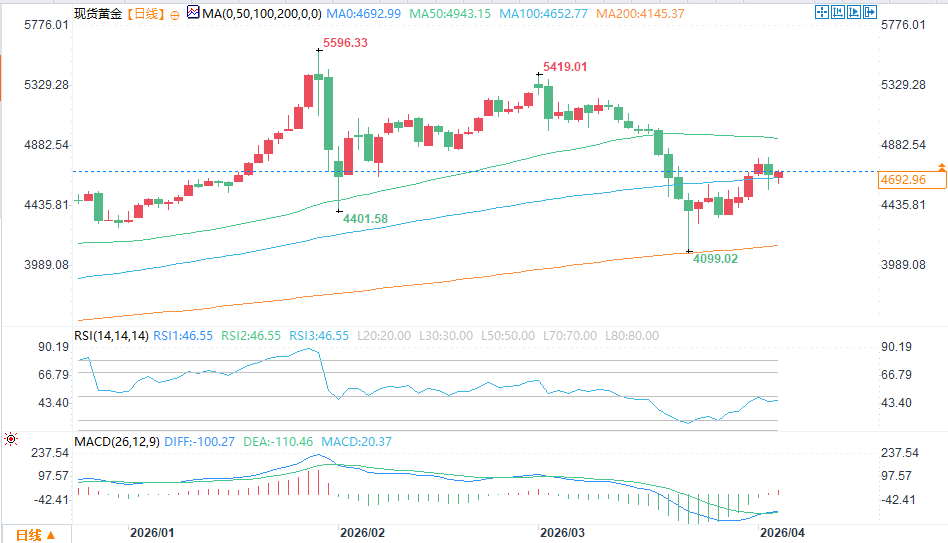
(Spot gold daily chart source: FX678)
First, it is a densely traded area before the gold price broke through $4,000 in the first half of 2025. A large number of institutions and retail investors completed their positions in this range, resulting in a concentrated cost distribution.
Secondly, it is close to the average gold purchase cost range of major central banks around the world (especially emerging market central banks in Asia) in 2024-2025, which is naturally attractive to long-term allocation funds.
Third, from a technical analysis perspective, the area is supported by multiple factors, including the 200-week moving average, the 38.2% Fibonacci retracement level, and the lower Bollinger Band.
The area above $5,000 contains a large amount of trapped capital from the fourth quarter of 2025 to January 2026, and selling pressure persists during any rebound. The funding structure further amplifies the range effect: leveraged longs are actively buying at around $4,400, while trend traders are reducing their positions and hedging above $5,000. Macroeconomic uncertainties act like "random noise," constantly disrupting the range boundaries.
Beyond the fluctuations, the bottom is rising.
While the short-term direction remains unclear, a growing cross-institutional consensus is that the long-term bottom for gold is systematically rising. This judgment rests on three solid pillars:
The trend of central bank gold purchases is irreversible. Global central bank net gold purchases reached the second-highest level on record in 2025, and this strong momentum continued into the first quarter of 2026. The reserve diversification strategies of countries like China, India, and Russia have not been halted by the gold price correction; on the contrary, they have accelerated their accumulation of gold at lower levels. IMF data shows that the proportion of gold in emerging market foreign exchange reserves has increased from 7% in 2019 to 11.5% at the beginning of 2026, and this trend is expected to continue.
Gold's allocation attributes continue to strengthen. Against the backdrop of rising global asset correlations and the ineffectiveness of the traditional 60/40 stock-bond portfolio, gold's role as a diversification tool with zero or low correlation is becoming increasingly prominent. Pension funds and family offices are already certain to increase their allocation ratios by 2025, and a moderate increase is expected in 2026.
Macroeconomic uncertainties remain. Geopolitical conflicts, debt ceiling negotiations, labor market restructuring driven by artificial intelligence, and supply chain risks posed by climate change... these variables have not disappeared due to the gold price correction; on the contrary, they continue to accumulate systemic risk premiums in a low-interest-rate environment.
Therefore, from a longer-term perspective, the question is no longer "whether gold will continue to rise," but rather "what pace and path will the rise take." The current fluctuations are themselves a necessary process for digesting previous overheated expectations and consolidating a new central level.
Investor takeaway: Embrace disagreement, not bet on extremes.
In this environment, simply and crudely judging the "top" or "starting point" could come at a cost. A more rational approach is to understand the structural changes reflected in the divergence itself: gold is transforming from a "one-sided bull market asset" to a "complex macro hedging + allocation asset."
For institutional investors, it is advisable to gradually increase their long positions in physical gold or futures in the $4,400-$4,500 range, while hedging short-term volatility risks through gold mining stocks or derivatives. For individual investors, a dollar-cost averaging plus rebalancing strategy is better than chasing highs and selling lows. For enterprises, appropriately increasing gold swaps or forward contracts to lock in costs in dollar financing is also a realistic option to hedge against the dual uncertainties of exchange rates and interest rates.
The risk warnings are equally clear: if the US economy experiences an unexpected hard landing, forcing the Federal Reserve to aggressively cut interest rates, gold could quickly break through $5,500; conversely, if inflation rises again beyond expectations and the dollar index returns above 110, the support level could shift down to $4,200. Black swan events (escalation of major geopolitical conflicts or a global financial crisis) could still disrupt the current range-bound equilibrium.
Conclusion
The current gold market is not lacking in trends, but rather in a transitional phase of trend shift. Intense competition between different narratives causes prices to fluctuate repeatedly within a range, making it difficult for the market to form a consensus. Against the backdrop of intertwined forces, gold is more likely to digest expectations through consolidation, gradually reshaping its price center in the process—perhaps not a V-shaped reversal, nor an L-shaped bottom, but a slowly rising "stepped" upward curve.
Disagreements are painful, but they are also a sign of market maturity. For investors who truly understand structural changes, this may be the golden window of opportunity to position themselves for the next trend. In the coming months, the $4,400-$5,000 range will become the most direct battleground for testing various narratives, and the ultimate winner will be the participant who is more adaptable to the new pricing paradigm and more capable of embracing complexity.
The underlying logic hasn't disappeared, but pricing has started to "malfunction."
Looking back at the gold bull market in 2025, its upward path was once so clear as to be almost textbook clear: repeated escalation of geopolitical conflicts in the Middle East boosted safe-haven sentiment, the Federal Reserve's interest rate cut cycle, which began at the end of 2024, continued to strengthen expectations of declining real interest rates, coupled with the allocation needs of emerging market central banks and sovereign wealth funds under the global wave of de-dollarization, the three forces resonated perfectly, pushing gold prices from around $3,200 at the end of 2024 all the way up to above $5,500.
Entering 2026, these three core logics did not seem to have weakened significantly on the surface—the situation in the Middle East remained tense, the Federal Reserve remained on an easing track, and the internationalization of non-US currencies such as the RMB and rupee accelerated—but the market's pricing reaction underwent a qualitative change.
The most typical example is the marginal failure of the "safe-haven attribute." Take the recent escalation of the Middle East conflict as an example. According to traditional logic, the intensification of conflict should directly stimulate safe-haven buying of gold, with prices expected to surge by at least 10%. However, in reality, gold prices experienced a phase of correction during the most intense period of the conflict. The underlying transmission chain has quietly shifted: geopolitical conflicts first push up energy prices such as crude oil, leading to repeated increases in global inflation expectations; inflation stickiness, in turn, supports a stronger US dollar index (DXY once rebounded above 108); a stronger dollar, coupled with increased volatility in global risk assets, forces leveraged funds and macro hedge funds to deleverage simultaneously. As a "non-interest-bearing asset," gold is passively pressured in this chain of tightening liquidity and dollar dominance. The traditional one-way logic of "geopolitics → safe-haven → rising gold prices" has been partially replaced by a complex feedback loop of "geopolitics → energy inflation → stronger dollar → tightening liquidity → pressure on gold." The safe-haven attribute has not disappeared; its transmission efficiency has simply been significantly diluted by macroeconomic and financial conditions.
The Fed's path is unclear, and the pricing anchor has become blurred.
While the shift in the hedging logic may be considered a marginal adjustment, the uncertainty surrounding monetary policy has directly shaken the core pricing foundation of gold—real interest rates. Gold has long exhibited a high degree of negative correlation with the real yield of 10-year TIPS (the correlation coefficient has consistently remained above -0.7). However, since the beginning of 2026, market expectations regarding the path of real interest rates have become severely divided.
On the one hand, US economic data showed unexpected resilience: the annualized quarter-on-quarter GDP growth rate in the first quarter of 2026 remained above 2.5%, non-farm payrolls continued to exceed expectations, and consumer spending did not show a significant decline. This has led to a continuous postponement of expectations for Federal Reserve rate cuts, with the market's implied cumulative number of rate cuts in 2026 compressed from 4-5 at the beginning of the year to around 2.
On the other hand, high and volatile energy prices and localized supply chain bottlenecks have kept core PCE inflation within a sticky range of 2.8%-3.2%, limiting the downside potential for real interest rates. As a result, traders are unable to form a clear "bullish consensus on gold" (significant interest rate cuts + low real interest rates) or lack sufficient "negative confirmation" (hard landing of the economy + aggressive easing).
With the pricing anchor unclear, gold's trending unilateral movement in 2025 naturally shifted to range-bound trading in 2026. The volatility index (GVZ) has fallen from its peak of 25 in 2025 to the current 12-15, and the implied volatility curve for options has also shown a significant flattening, reflecting a substantial decline in the market's willingness to make directional bets.
While many institutions are bullish, their differing opinions are widening.
Market divergences are particularly evident in research reports from top institutions. Goldman Sachs and UBS, for example, both maintain a long-term bullish stance, but their starting points, pricing frameworks, and target price paths differ significantly.
Goldman Sachs' analytical framework focuses more on the "current supply and demand structure." Its latest report points out that emerging market central banks (represented by China, India, Turkey, and Poland) will net purchases of gold exceeding 1,100 tons in 2025, with this momentum continuing into the first quarter of 2026. Meanwhile, global pension funds and sovereign wealth funds are increasing their gold allocation from the historical average of 1.5% to 2.5%-3% in their asset allocations, providing a stable "floor." Goldman Sachs believes this demand is more of a "defensive allocation" rather than an "offensive chasing of the rally," therefore its forecast for gold prices leans towards a moderate upward revision—a target price of $5,200-$5,400 by the end of 2026 under the baseline scenario, emphasizing a "slow bull" market.
UBS's perspective leans more towards "macroeconomic cycles and systemic risks." Their report analyzes gold within the framework of a longer-term monetary system restructuring and global debt expansion: the global public debt-to-GDP ratio is approaching 120%, fiscal space in major economies continues to shrink, and geopolitical conflicts are viewed as structural rather than cyclical variables. Within this framework, the trend of interest rate cuts, the marginal weakening of the US dollar's credit, and demand for safe-haven assets are seen as persistent bullish factors. UBS is therefore more aggressive on the upside potential, maintaining its target range of $5,500-$6,000 for 2026, believing that the current fluctuations around $4,700 are merely a "bull market consolidation platform" rather than a trend reversal.
Similar disagreements are also reflected in other institutions: JPMorgan Chase leans more towards Goldman Sachs' supply and demand-based logic, with a relatively conservative target price; Societe Generale, on the other hand, is closer to UBS, emphasizing a "debt-currency-gold" triad framework. This divergence in institutional views is directly reflected in the positioning data: CFTC gold futures net long positions have fallen from nearly 300,000 contracts at their 2025 high to around 120,000 contracts currently, but have not turned net short, indicating that both bulls and bears are waiting for a clearer catalyst.
Behind the disagreement lies a competition between two pricing methods.
At a deeper level, this institutional disagreement is not simply a debate over whether the target price is high or low, but rather a parallel game between two completely different pricing paradigms.
The first approach is "pricing based on actual supply and demand and capital flows": it emphasizes quantifiable variables such as current physical buying, central bank gold purchases, ETF holdings, and mineral supply (global mine production is projected to increase by only 1.2% in 2025). The core logic is that "prices are determined by marginal buying." This paradigm performed exceptionally well in 2025, when trends were clear and liquidity was ample, but its predictive ability significantly declined after entering the period of macroeconomic uncertainty in 2026.
The second approach is "macrocycle and risk structure pricing": focusing on long-term uncertainties such as debt ceilings, fragmentation of the monetary system, and the probability distribution of geopolitical black swan events. The core logic is that "valuation is determined by systemic risk premium." This paradigm is better at capturing trend reversals, but it is easily affected by liquidity shocks in the short term.
When the market is in a clear trend phase, both factors reinforce each other, forming a positive feedback loop. However, once it enters a transitional phase (as is the case now), the differences are rapidly amplified, manifesting as high-frequency price fluctuations and fluctuating expectations. The $4400-$4500 range is becoming the focal point of this competition.
Why has the $4400-$4500 price range become a focal point of disagreement?
This price range is by no means accidental.
(Spot gold daily chart source: FX678)
First, it is a densely traded area before the gold price broke through $4,000 in the first half of 2025. A large number of institutions and retail investors completed their positions in this range, resulting in a concentrated cost distribution.
Secondly, it is close to the average gold purchase cost range of major central banks around the world (especially emerging market central banks in Asia) in 2024-2025, which is naturally attractive to long-term allocation funds.
Third, from a technical analysis perspective, the area is supported by multiple factors, including the 200-week moving average, the 38.2% Fibonacci retracement level, and the lower Bollinger Band.
The area above $5,000 contains a large amount of trapped capital from the fourth quarter of 2025 to January 2026, and selling pressure persists during any rebound. The funding structure further amplifies the range effect: leveraged longs are actively buying at around $4,400, while trend traders are reducing their positions and hedging above $5,000. Macroeconomic uncertainties act like "random noise," constantly disrupting the range boundaries.
Beyond the fluctuations, the bottom is rising.
While the short-term direction remains unclear, a growing cross-institutional consensus is that the long-term bottom for gold is systematically rising. This judgment rests on three solid pillars:
The trend of central bank gold purchases is irreversible. Global central bank net gold purchases reached the second-highest level on record in 2025, and this strong momentum continued into the first quarter of 2026. The reserve diversification strategies of countries like China, India, and Russia have not been halted by the gold price correction; on the contrary, they have accelerated their accumulation of gold at lower levels. IMF data shows that the proportion of gold in emerging market foreign exchange reserves has increased from 7% in 2019 to 11.5% at the beginning of 2026, and this trend is expected to continue.
Gold's allocation attributes continue to strengthen. Against the backdrop of rising global asset correlations and the ineffectiveness of the traditional 60/40 stock-bond portfolio, gold's role as a diversification tool with zero or low correlation is becoming increasingly prominent. Pension funds and family offices are already certain to increase their allocation ratios by 2025, and a moderate increase is expected in 2026.
Macroeconomic uncertainties remain. Geopolitical conflicts, debt ceiling negotiations, labor market restructuring driven by artificial intelligence, and supply chain risks posed by climate change... these variables have not disappeared due to the gold price correction; on the contrary, they continue to accumulate systemic risk premiums in a low-interest-rate environment.
Therefore, from a longer-term perspective, the question is no longer "whether gold will continue to rise," but rather "what pace and path will the rise take." The current fluctuations are themselves a necessary process for digesting previous overheated expectations and consolidating a new central level.
Investor takeaway: Embrace disagreement, not bet on extremes.
In this environment, simply and crudely judging the "top" or "starting point" could come at a cost. A more rational approach is to understand the structural changes reflected in the divergence itself: gold is transforming from a "one-sided bull market asset" to a "complex macro hedging + allocation asset."
For institutional investors, it is advisable to gradually increase their long positions in physical gold or futures in the $4,400-$4,500 range, while hedging short-term volatility risks through gold mining stocks or derivatives. For individual investors, a dollar-cost averaging plus rebalancing strategy is better than chasing highs and selling lows. For enterprises, appropriately increasing gold swaps or forward contracts to lock in costs in dollar financing is also a realistic option to hedge against the dual uncertainties of exchange rates and interest rates.
The risk warnings are equally clear: if the US economy experiences an unexpected hard landing, forcing the Federal Reserve to aggressively cut interest rates, gold could quickly break through $5,500; conversely, if inflation rises again beyond expectations and the dollar index returns above 110, the support level could shift down to $4,200. Black swan events (escalation of major geopolitical conflicts or a global financial crisis) could still disrupt the current range-bound equilibrium.
Conclusion
The current gold market is not lacking in trends, but rather in a transitional phase of trend shift. Intense competition between different narratives causes prices to fluctuate repeatedly within a range, making it difficult for the market to form a consensus. Against the backdrop of intertwined forces, gold is more likely to digest expectations through consolidation, gradually reshaping its price center in the process—perhaps not a V-shaped reversal, nor an L-shaped bottom, but a slowly rising "stepped" upward curve.
Disagreements are painful, but they are also a sign of market maturity. For investors who truly understand structural changes, this may be the golden window of opportunity to position themselves for the next trend. In the coming months, the $4,400-$5,000 range will become the most direct battleground for testing various narratives, and the ultimate winner will be the participant who is more adaptable to the new pricing paradigm and more capable of embracing complexity.
- Risk Warning and Disclaimer
- The market involves risk, and trading may not be suitable for all investors. This article is for reference only and does not constitute personal investment advice, nor does it take into account certain users’ specific investment objectives, financial situation, or other needs. Any investment decisions made based on this information are at your own risk.