Technical Analysis: Gold found support at the 100-day moving average near 4600.
2026-04-06 21:29:45
Gold prices stabilized on Monday (April 6), finding support near the 100-day simple moving average (SMA) at around $4,652, narrowing their losses after falling on Friday due to strong U.S. jobs data and renewed escalation of the conflict with Iran, which dampened expectations of a Federal Reserve rate cut.

Momentum indicators suggest that bearish pressure is easing: the MACD indicator has turned upward above the signal line, but is still below the zero line; the Relative Strength Index (RSI) is flattening below the 50 neutral level – indicating that although selling momentum has cooled somewhat, the overall bearish tone remains.
If gold prices rebound from the 100-day moving average support level, the upside target will be a key confluence resistance level: the intersection of the medium-term uptrend line and the 20-day moving average, which is also the 50% Fibonacci retracement level of the March 2-23 correction, around 4558.
Only if it can effectively hold above 4850 can the current downward trend be reversed, and then a rebound can be launched towards the 50-day moving average around 4944.
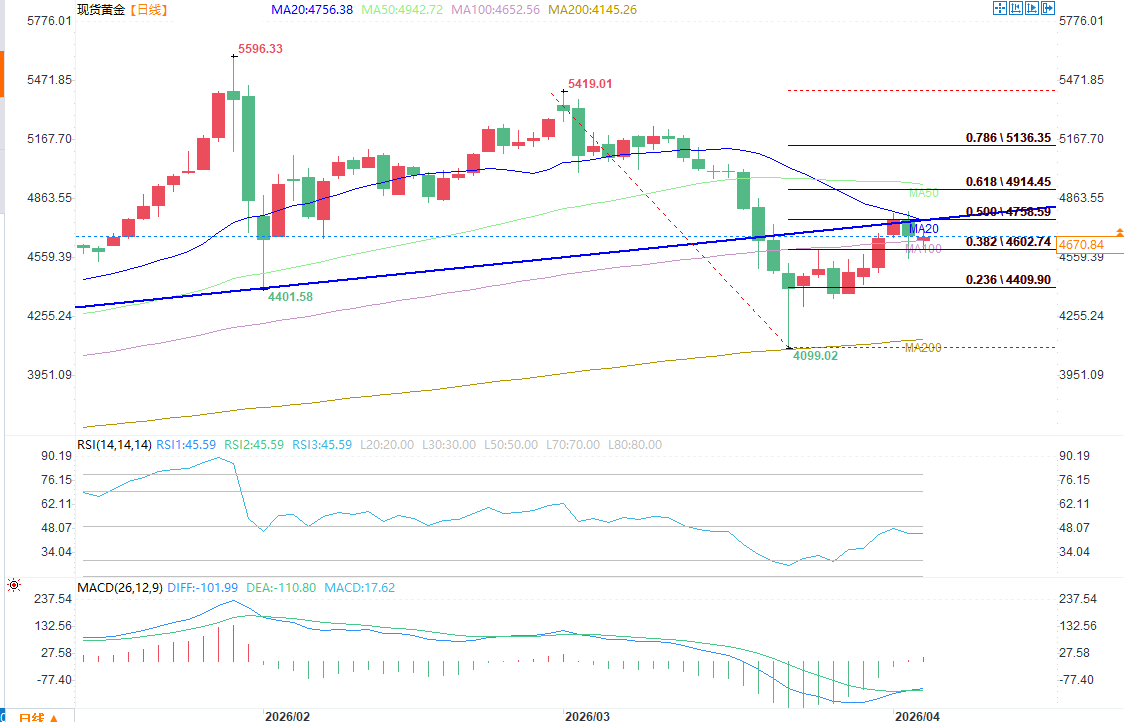
(Spot gold daily chart source: FX678)
Conversely, if gold prices break below the 4600 level, the next target will be the 4550-4375 trading range established in late March, followed by the 4150 level near the 200-day moving average, which is slightly higher than the psychological level of 4000.
Overall, gold found some support around 4600 and attempted a rebound, but insufficient buying support kept the short-term trend bearish. Although gold prices have repeatedly tried to recover the upward trend line, they remain under pressure below it. Whether the 4550 level can be held is crucial to preventing further intensification of bearish momentum.
Momentum indicators suggest that bearish pressure is easing: the MACD indicator has turned upward above the signal line, but is still below the zero line; the Relative Strength Index (RSI) is flattening below the 50 neutral level – indicating that although selling momentum has cooled somewhat, the overall bearish tone remains.
If gold prices rebound from the 100-day moving average support level, the upside target will be a key confluence resistance level: the intersection of the medium-term uptrend line and the 20-day moving average, which is also the 50% Fibonacci retracement level of the March 2-23 correction, around 4558.
Only if it can effectively hold above 4850 can the current downward trend be reversed, and then a rebound can be launched towards the 50-day moving average around 4944.
(Spot gold daily chart source: FX678)
Conversely, if gold prices break below the 4600 level, the next target will be the 4550-4375 trading range established in late March, followed by the 4150 level near the 200-day moving average, which is slightly higher than the psychological level of 4000.
Overall, gold found some support around 4600 and attempted a rebound, but insufficient buying support kept the short-term trend bearish. Although gold prices have repeatedly tried to recover the upward trend line, they remain under pressure below it. Whether the 4550 level can be held is crucial to preventing further intensification of bearish momentum.
- Risk Warning and Disclaimer
- The market involves risk, and trading may not be suitable for all investors. This article is for reference only and does not constitute personal investment advice, nor does it take into account certain users’ specific investment objectives, financial situation, or other needs. Any investment decisions made based on this information are at your own risk.