It fell for three consecutive months, yet the dollar remained completely unmoved?
2026-04-07 20:57:32
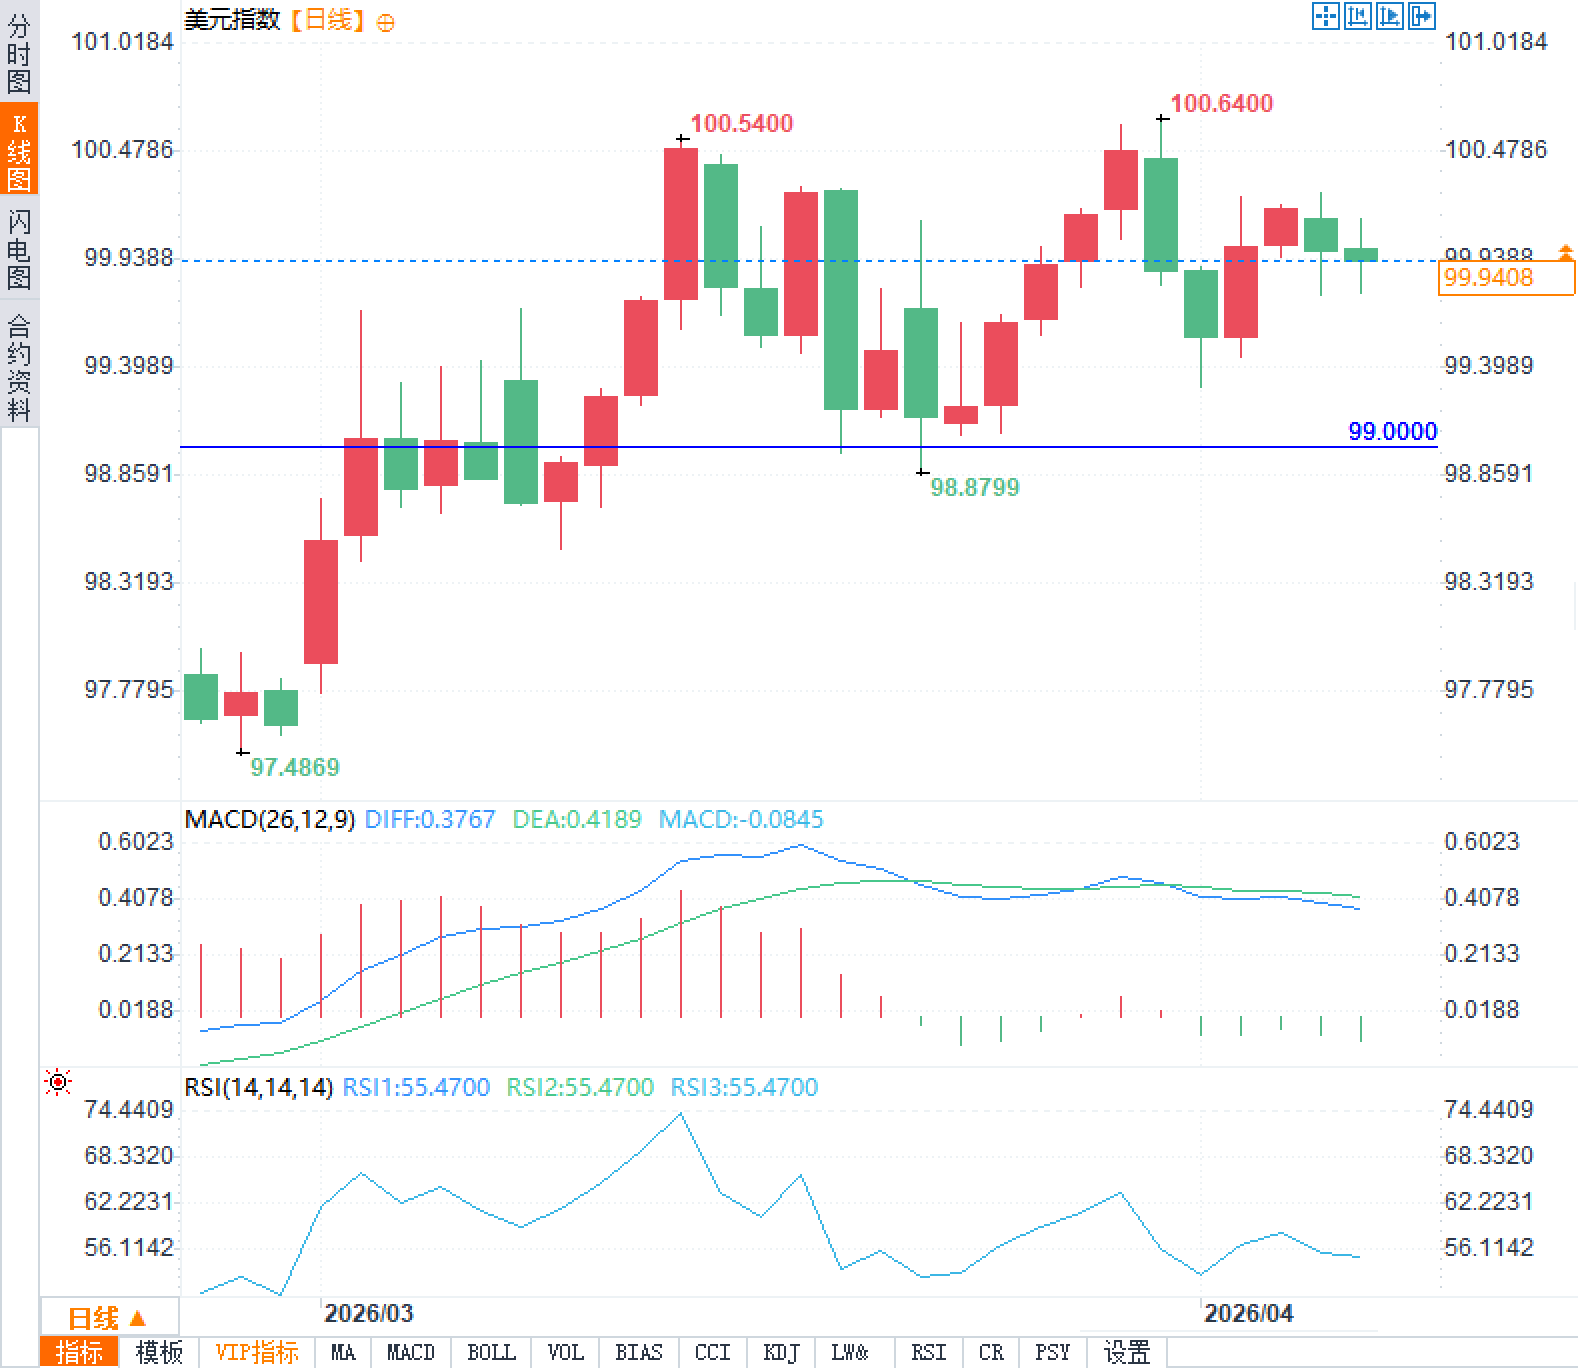
On Tuesday, April 7th, the US released its February durable goods new orders data, drawing close market attention. The data showed a 1.4% month-over-month decline to $315.5 billion, marking the third consecutive month of decline and far exceeding the market's expected 0.5% drop. Meanwhile, the US dollar index remained in a narrow range around 100.00 before and after the data release, without showing any significant unilateral movement. This background highlights the complexity of manufacturing signals: on the one hand, weak orders reflect demand-side pressure; on the other hand, the restrained exchange rate reaction suggests a complex interplay of factors, including seasonal fluctuations in the transportation sector and other concurrent fundamental variables.

New orders for durable goods in February fell by $4.4 billion to $315.5 billion, continuing the revised 0.5% decline from January. Transportation equipment was the biggest drag, falling 5.4% month-over-month to $106.1 billion, marking the fourth negative growth in four consecutive months. Breaking it down further, orders for non-defense aircraft and components plummeted 28.6% to $19.2 billion, becoming the largest single negative contributor, highlighting the highly volatile nature of this subcategory and its susceptibility to large project delivery cycles. Excluding transportation equipment, new orders rebounded slightly by 0.8%, indicating that core manufacturing still has some support. Further analysis shows that new orders for basic metals increased by 2.2% to $28.6 billion, and machinery and equipment increased by 1.5% to $41.1 billion, becoming positive drivers. Excluding defense, new orders declined by 1.2% overall. Key data comparisons are as follows:
This breakdown shows that the overall data is dominated by fluctuations in a single sector, while the moderate positive growth of core indicators provides a balancing perspective, contrasting with the demand recovery shown by some leading indicators. However, the actual hard data still points to cautious demand.
Durable goods orders, as a leading indicator of corporate capital expenditure, directly reflect the willingness to invest in fixed assets and have a significant weight in quarterly GDP. The decline for three consecutive months, particularly driven by transportation equipment, suggests that the manufacturing sector as a whole is facing pressure from slowing demand, which may spill over into industrial production, employment, and inventory management. The transportation sector has historically been highly volatile; a single delay or cancellation can cause significant deviations, and the four declines in the past five months have further reinforced this trend signal.
In contrast, the 0.8% growth excluding transportation was supported by base metals and machinery, potentially reflecting resilience in downstream non-cyclical demand, such as equipment upgrades or supply chain restocking. However, the contrast with leading indicators is noteworthy: while leading indicators previously showed strong demand from goods producers, actual orders this time were weaker than expected, possibly due to sample differences, seasonal adjustments, or companies' wait-and-see attitude towards macroeconomic uncertainties. If this pattern continues, a slowdown in manufacturing investment could amplify the downside risks of the economic cycle, and traders often use this to assess the future trends of the industrial output index and the purchasing managers' index. Overall, the data reveals that the manufacturing sector is not in a complete collapse, but rather faces both structural pressures and localized resilience, requiring further verification of its sustainability with subsequent monthly data.
Following the data release, the US dollar index did not decline significantly, remaining relatively stable around 100.00, which contrasts with the intuitive expectation that weak data typically depresses exchange rates. This is because the market may have already partially priced in the seasonal noise from the transportation sector, focusing more on core recovery signals excluding transportation. Meanwhile, the dollar's movement is driven by interest rate expectations and interest rate differentials; the decline in orders may reinforce bets on slower growth, but the limited magnitude suggests that other driving factors are prevailing. Traders observed that the immediate impact of a single manufacturing indicator on exchange rates is often diluted by a multivariate framework, especially when data volatility is high, with exchange rates tending to fluctuate within a range rather than break out of a trend.
Weak durable goods orders provide new input for the Federal Reserve's assessment of economic growth and price stability. A decline in manufacturing investment may ease pressure from capacity bottlenecks and reduce upside risks to inflation in the medium to long term, but it could also widen the output gap, prompting a shift in the policy path towards greater flexibility. However, the slight positive growth in core orders suggests that the economy is not in a full-blown slowdown, and policymakers may continue to emphasize a data-dependent strategy. In the long term, if the order trend remains weak, market expectations for future interest rate trajectories may gradually revise, thereby affecting the relative attractiveness of the US dollar.
Detailed Analysis of New Orders Data for Durable Goods
New orders for durable goods in February fell by $4.4 billion to $315.5 billion, continuing the revised 0.5% decline from January. Transportation equipment was the biggest drag, falling 5.4% month-over-month to $106.1 billion, marking the fourth negative growth in four consecutive months. Breaking it down further, orders for non-defense aircraft and components plummeted 28.6% to $19.2 billion, becoming the largest single negative contributor, highlighting the highly volatile nature of this subcategory and its susceptibility to large project delivery cycles. Excluding transportation equipment, new orders rebounded slightly by 0.8%, indicating that core manufacturing still has some support. Further analysis shows that new orders for basic metals increased by 2.2% to $28.6 billion, and machinery and equipment increased by 1.5% to $41.1 billion, becoming positive drivers. Excluding defense, new orders declined by 1.2% overall. Key data comparisons are as follows:
| category | Month-on-month change (%) | February amount (US$ billion) |
|---|---|---|
| Overall new orders | -1.4 | 3155 |
| Transportation equipment | -5.4 | 1061 |
| Non-defense aircraft and parts | -28.6 | 192 |
| Exclude transportation equipment | +0.8 | — |
| base metals | +2.2 | 286 |
| mechanical | +1.5 | 411 |
In-depth analysis of manufacturing demand signals
Durable goods orders, as a leading indicator of corporate capital expenditure, directly reflect the willingness to invest in fixed assets and have a significant weight in quarterly GDP. The decline for three consecutive months, particularly driven by transportation equipment, suggests that the manufacturing sector as a whole is facing pressure from slowing demand, which may spill over into industrial production, employment, and inventory management. The transportation sector has historically been highly volatile; a single delay or cancellation can cause significant deviations, and the four declines in the past five months have further reinforced this trend signal.
In contrast, the 0.8% growth excluding transportation was supported by base metals and machinery, potentially reflecting resilience in downstream non-cyclical demand, such as equipment upgrades or supply chain restocking. However, the contrast with leading indicators is noteworthy: while leading indicators previously showed strong demand from goods producers, actual orders this time were weaker than expected, possibly due to sample differences, seasonal adjustments, or companies' wait-and-see attitude towards macroeconomic uncertainties. If this pattern continues, a slowdown in manufacturing investment could amplify the downside risks of the economic cycle, and traders often use this to assess the future trends of the industrial output index and the purchasing managers' index. Overall, the data reveals that the manufacturing sector is not in a complete collapse, but rather faces both structural pressures and localized resilience, requiring further verification of its sustainability with subsequent monthly data.
The Market Reaction Logic of the US Dollar Index
Following the data release, the US dollar index did not decline significantly, remaining relatively stable around 100.00, which contrasts with the intuitive expectation that weak data typically depresses exchange rates. This is because the market may have already partially priced in the seasonal noise from the transportation sector, focusing more on core recovery signals excluding transportation. Meanwhile, the dollar's movement is driven by interest rate expectations and interest rate differentials; the decline in orders may reinforce bets on slower growth, but the limited magnitude suggests that other driving factors are prevailing. Traders observed that the immediate impact of a single manufacturing indicator on exchange rates is often diluted by a multivariate framework, especially when data volatility is high, with exchange rates tending to fluctuate within a range rather than break out of a trend.
Monetary Policy Expectations and Market Outlook
Weak durable goods orders provide new input for the Federal Reserve's assessment of economic growth and price stability. A decline in manufacturing investment may ease pressure from capacity bottlenecks and reduce upside risks to inflation in the medium to long term, but it could also widen the output gap, prompting a shift in the policy path towards greater flexibility. However, the slight positive growth in core orders suggests that the economy is not in a full-blown slowdown, and policymakers may continue to emphasize a data-dependent strategy. In the long term, if the order trend remains weak, market expectations for future interest rate trajectories may gradually revise, thereby affecting the relative attractiveness of the US dollar.
- Risk Warning and Disclaimer
- The market involves risk, and trading may not be suitable for all investors. This article is for reference only and does not constitute personal investment advice, nor does it take into account certain users’ specific investment objectives, financial situation, or other needs. Any investment decisions made based on this information are at your own risk.