Technical Analysis: Silver is at a crossroads; a bullish breakout is encountering overbought momentum.
2026-04-14 19:41:48
On Tuesday (April 14), silver prices rebounded strongly during the European session, with spot silver trading at $77.89 per ounce, a significant increase of 3.00% from Monday's $75.62. This substantial rise not only reversed recent downward pressure but also pushed silver's year-to-date gain to 9.57%.

Meanwhile, the gold/silver ratio fell sharply from 62.72 on Monday to 61.40, indicating a significant increase in the relative strength of silver in the precious metals sector (at the current exchange rate, silver is priced at approximately $2.50 per gram).
From a technical perspective, silver prices not only successfully recovered key short-term moving averages on Tuesday, but also saw a significant increase in trading volume, indicating that bullish momentum is rapidly accumulating. The breakout of the upper edge of the recent trading range releases a relatively strong bullish signal.
The bulls' short-term target is the key psychological level of $80.00, while $75.00 has been confirmed as a key support level. Momentum indicators across multiple timeframes are showing overbought signals, suggesting that remaining cautious and patiently waiting for a price pullback to the support level before entering the market might be a more prudent choice.
Daily chart: Challenging the bearish trendline of several months
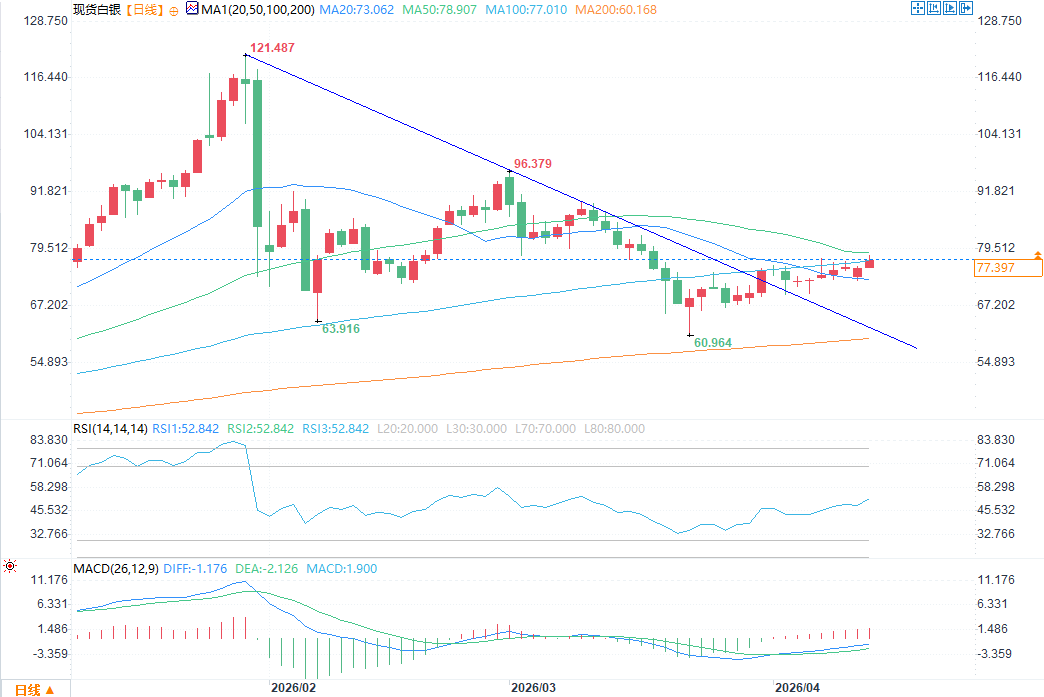
The daily chart for silver presents a complex technical battle. After experiencing significant volatility in early 2026, the price action has entered a recovery phase and is currently testing a key structural resistance level.
The constraining effect of trend lines: The core focus of the daily chart is the long-term downtrend line (dark blue line) extending from the high point at the end of January. The current price is attempting to break through this trend line, which has historically suppressed upward momentum multiple times.
The convergence of moving averages: Silver's current price has risen above the 200-day moving average (orange line, value 60.168). However, the 100-day moving average (value 77.011) is still higher than the current price. If the daily closing price can hold above this line, it will signify confirmation of the long-term bullish trend.
Support and Resistance Levels: The psychological level of $75.00 has now become a support level. The next major target for the bulls is the $80.00 level, followed by the technical resistance zone at $82.16.
Momentum indicators: The current RSI value is 53.062, slightly above the neutral level of 50, indicating that bullish momentum is gradually returning.
4-hour chart (240 minutes): Bullish momentum continues to strengthen.
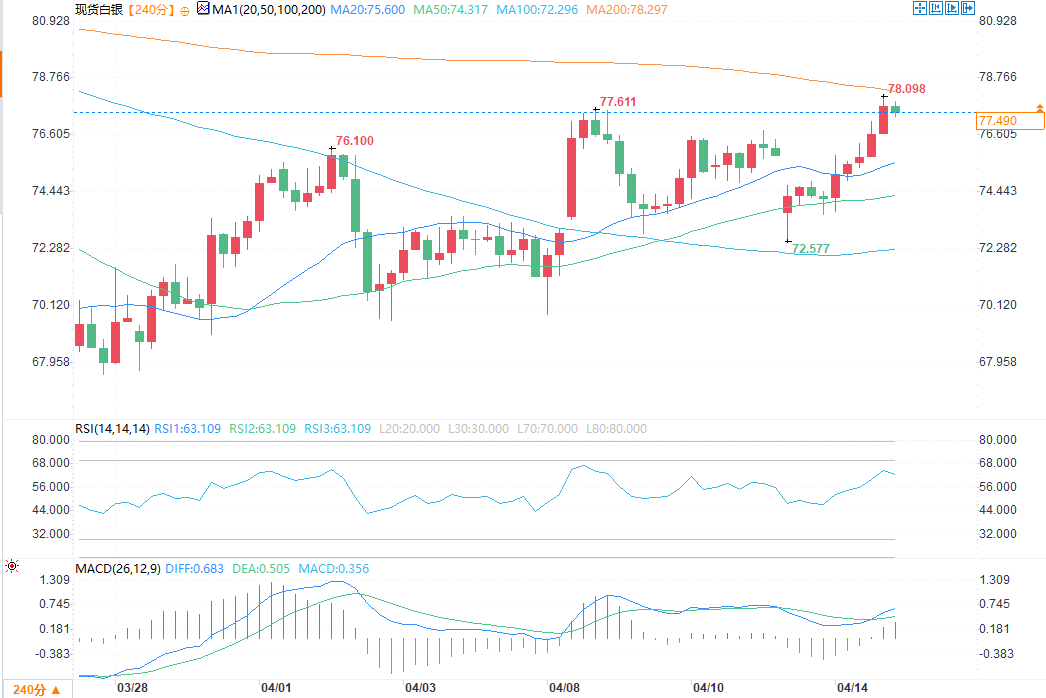
Switching to the 4-hour chart, the bullish logic becomes clearer, with prices exhibiting a typical "step-like" upward pattern—highs and lows rising simultaneously.
Breakout Confirmation: The 4-hour chart shows that the price has decisively broken through the $75.00 level. Support in this area has been further strengthened as the price continues to trade above the immediate dynamic support provided by the 100-day moving average (value 72.296).
Moving average alignment: The moving averages on the 4-hour chart have begun to turn upwards, with only the 200-day moving average (orange line, value 78.297) slightly above the current price. A break above this moving average (around $78.46) would further solidify the bullish logic and push the price towards $80.00 and higher.
Indicator signal: The 4-hour RSI value is 63.286, which has not yet entered the extreme overbought zone, indicating that the price still has some room to rise.
1-hour chart (60-minute chart): Slow upward trend in the short term.
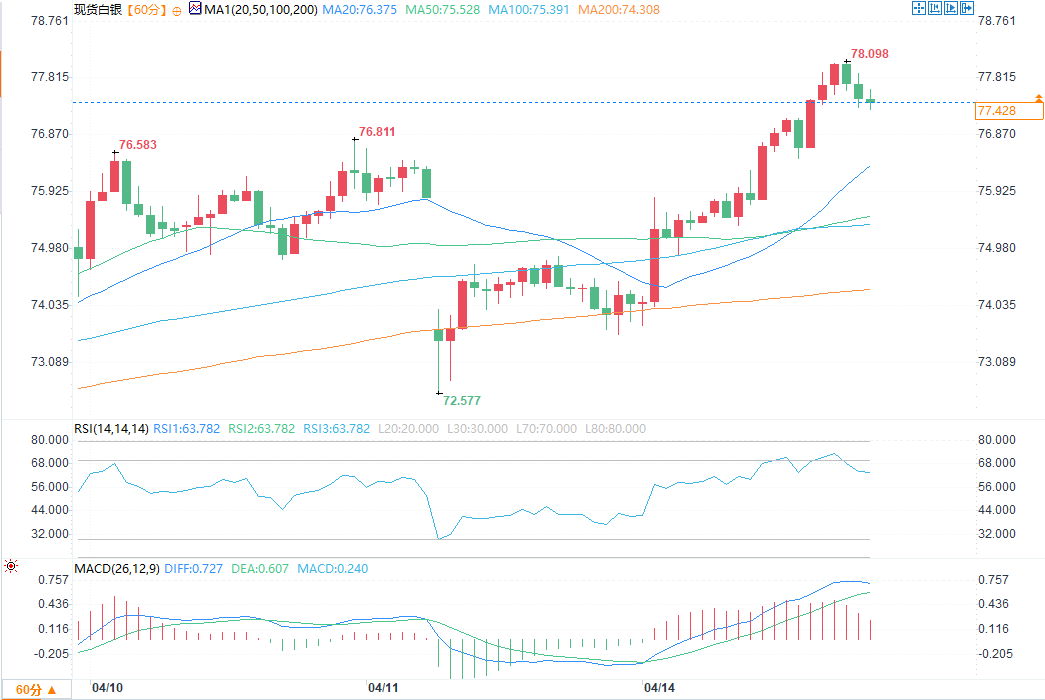
The 1-hour chart shows a clear intraday uptrend. Over the past few trading days, silver prices have steadily risen, guided by short-term moving averages.
Immediate support level: The 100-day moving average (value 75.392) corresponds to the $75.35 level, which is a key support line for intraday traders. As long as the price remains above this level, "buying on dips" remains the dominant trading strategy.
Price target: The immediate target is the psychological level of $78.00. If the momentum continues, the path to the $80.00 resistance level will be very smooth.
Divergence Warning: Despite the price reaching new highs, the RSI indicator is showing signs of momentum exhaustion (currently at 64.968, nearing overbought territory). This could lead to a slight price pullback towards the $75.00–$75.50 range before resuming a new upward trend.
Silver is currently in a "verification phase." A breakout of the downtrend line on the daily chart is an important technical milestone, but a daily closing price above $77.00 is needed to confirm that the bears have completely lost control.
Bullish Strategy : Bulls will focus on a successful pullback to the $75.00 area. If this support level holds during the pullback, the next reasonable target is the psychological resistance level of $80.00. A break above this level could see the price move further towards the $82.00–$83.00 range.
Short-selling strategy : For short sellers to regain control, they need to create a "false breakout" – forcing the price back below the downtrend line and breaking below the $75.00 support level. If the price falls below $74.00, the current bullish structure will fail, and it will likely return to the $70.00 support zone.
Key takeaway : The path of least resistance for the current price remains upward, but oscillators across multiple timeframes have entered overbought territory. Rather than chasing the current breakout, patiently waiting for a price pullback to near support levels to find a "value entry point" may yield better trading results.
Meanwhile, the gold/silver ratio fell sharply from 62.72 on Monday to 61.40, indicating a significant increase in the relative strength of silver in the precious metals sector (at the current exchange rate, silver is priced at approximately $2.50 per gram).
From a technical perspective, silver prices not only successfully recovered key short-term moving averages on Tuesday, but also saw a significant increase in trading volume, indicating that bullish momentum is rapidly accumulating. The breakout of the upper edge of the recent trading range releases a relatively strong bullish signal.
The bulls' short-term target is the key psychological level of $80.00, while $75.00 has been confirmed as a key support level. Momentum indicators across multiple timeframes are showing overbought signals, suggesting that remaining cautious and patiently waiting for a price pullback to the support level before entering the market might be a more prudent choice.
Daily chart: Challenging the bearish trendline of several months
The daily chart for silver presents a complex technical battle. After experiencing significant volatility in early 2026, the price action has entered a recovery phase and is currently testing a key structural resistance level.
The constraining effect of trend lines: The core focus of the daily chart is the long-term downtrend line (dark blue line) extending from the high point at the end of January. The current price is attempting to break through this trend line, which has historically suppressed upward momentum multiple times.
The convergence of moving averages: Silver's current price has risen above the 200-day moving average (orange line, value 60.168). However, the 100-day moving average (value 77.011) is still higher than the current price. If the daily closing price can hold above this line, it will signify confirmation of the long-term bullish trend.
Support and Resistance Levels: The psychological level of $75.00 has now become a support level. The next major target for the bulls is the $80.00 level, followed by the technical resistance zone at $82.16.
Momentum indicators: The current RSI value is 53.062, slightly above the neutral level of 50, indicating that bullish momentum is gradually returning.
4-hour chart (240 minutes): Bullish momentum continues to strengthen.
Switching to the 4-hour chart, the bullish logic becomes clearer, with prices exhibiting a typical "step-like" upward pattern—highs and lows rising simultaneously.
Breakout Confirmation: The 4-hour chart shows that the price has decisively broken through the $75.00 level. Support in this area has been further strengthened as the price continues to trade above the immediate dynamic support provided by the 100-day moving average (value 72.296).
Moving average alignment: The moving averages on the 4-hour chart have begun to turn upwards, with only the 200-day moving average (orange line, value 78.297) slightly above the current price. A break above this moving average (around $78.46) would further solidify the bullish logic and push the price towards $80.00 and higher.
Indicator signal: The 4-hour RSI value is 63.286, which has not yet entered the extreme overbought zone, indicating that the price still has some room to rise.
1-hour chart (60-minute chart): Slow upward trend in the short term.
The 1-hour chart shows a clear intraday uptrend. Over the past few trading days, silver prices have steadily risen, guided by short-term moving averages.
Immediate support level: The 100-day moving average (value 75.392) corresponds to the $75.35 level, which is a key support line for intraday traders. As long as the price remains above this level, "buying on dips" remains the dominant trading strategy.
Price target: The immediate target is the psychological level of $78.00. If the momentum continues, the path to the $80.00 resistance level will be very smooth.
Divergence Warning: Despite the price reaching new highs, the RSI indicator is showing signs of momentum exhaustion (currently at 64.968, nearing overbought territory). This could lead to a slight price pullback towards the $75.00–$75.50 range before resuming a new upward trend.
Silver is currently in a "verification phase." A breakout of the downtrend line on the daily chart is an important technical milestone, but a daily closing price above $77.00 is needed to confirm that the bears have completely lost control.
Bullish Strategy : Bulls will focus on a successful pullback to the $75.00 area. If this support level holds during the pullback, the next reasonable target is the psychological resistance level of $80.00. A break above this level could see the price move further towards the $82.00–$83.00 range.
Short-selling strategy : For short sellers to regain control, they need to create a "false breakout" – forcing the price back below the downtrend line and breaking below the $75.00 support level. If the price falls below $74.00, the current bullish structure will fail, and it will likely return to the $70.00 support zone.
Key takeaway : The path of least resistance for the current price remains upward, but oscillators across multiple timeframes have entered overbought territory. Rather than chasing the current breakout, patiently waiting for a price pullback to near support levels to find a "value entry point" may yield better trading results.
- Risk Warning and Disclaimer
- The market involves risk, and trading may not be suitable for all investors. This article is for reference only and does not constitute personal investment advice, nor does it take into account certain users’ specific investment objectives, financial situation, or other needs. Any investment decisions made based on this information are at your own risk.