Gold rises as Iran reopens the Strait of Hormuz, oil prices plummet, and expectations for a Fed rate cut strengthen.
2026-04-18 02:15:12
Gold prices surged on Friday (April 17), driven by expectations of a deal between the US and Iran. Iran's reopening of the Strait of Hormuz led to a sharp drop in oil prices, easing inflationary pressures and further strengthening market expectations for a Federal Reserve rate cut. Spot gold traded around $4,863, up nearly 1.67% on the day, and is on track for its fourth consecutive week of gains.

Expectations for a US-Iran reconciliation are rising.
Iranian Foreign Minister Abbas Araghchi said on Friday that the Strait of Hormuz has been fully open to all commercial vessels during the ceasefire, in line with the ceasefire agreement in Lebanon.
Following this news, crude oil prices plummeted, with West Texas Intermediate (WTI) crude falling to its lowest level since March 11. As of press time, WTI crude was trading around $81.50, down nearly 9% on the day.
US President Trump also signaled progress in diplomacy with Iran on Thursday: "There is a very high chance that we will reach an agreement with Iran, and it will be a good agreement," he told reporters at the White House, adding that the next round of negotiations could be held this weekend; if the two sides are close to reaching an agreement, he will consider extending the current ceasefire.
Despite some easing of tensions, gold remains range-bound. Expectations of a deal boosted market risk appetite, leading to gains in global stock markets and limiting capital inflows into gold. Meanwhile, a weaker dollar provided support for spot gold, limiting its downside potential.
The US dollar index (DXY) is trading around 97.98, having fallen to a new low in more than a month and is on track for its third consecutive week of decline.
Oil prices cool, and expectations of a Fed rate cut return.
Meanwhile, as the conflict with Iran may be nearing its end, oil prices have fallen, geopolitical risk premiums have diminished, and markets are reassessing the Federal Reserve's monetary policy path.
This eased market concerns about inflation and reignited expectations of a Federal Reserve rate cut this year. Lower interest rates typically benefit non-interest-bearing assets like gold.
Looking ahead, traders will be closely watching the progress of US-Iran negotiations this weekend, especially developments regarding the full reopening of the Strait of Hormuz. Trump stated that the US naval blockade against Iran will continue in full until a final agreement is reached.
According to a Reuters report citing Iran's official Fars News Agency, Iranian officials said that if the blockade continues, Tehran will consider it a violation of the ceasefire agreement and may close the Strait of Hormuz again.
On the data front, the US economic data is light, with no major releases scheduled. Market focus will shift to speeches by Federal Reserve officials in preparation for the quiet period leading up to the FOMC meeting on April 28-29.
Technical Analysis: Spot gold is consolidating, with Bollinger Bands narrowing; watch for a breakout.
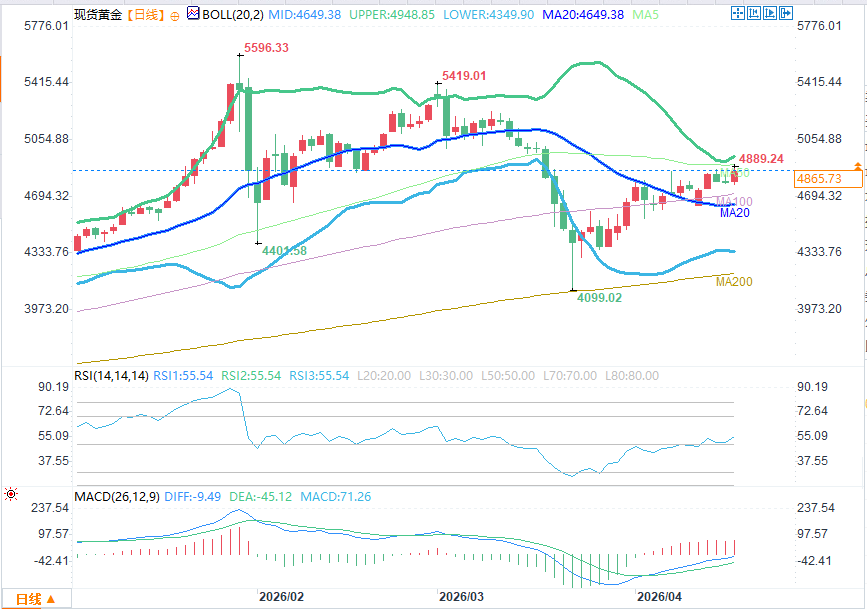
(Spot gold daily chart source: FX678)
On the daily chart, spot gold is trading steadily above the Bollinger Band middle line/20-day simple moving average (SMA) at $4649, and has also risen above the 100-day moving average, indicating a short-term bullish trend. The narrowing Bollinger Bands suggest decreasing volatility, foreshadowing the start of a new upward move.
The Relative Strength Index (RSI14) is hovering around 55.4, which is above the neutral level of 50, reflecting that bullish momentum has recovered and has not yet entered the overbought zone. The rebound from the previous oversold area indicates that downward pressure has eased. The MACD indicator shows that although the DIFF line is still below the zero axis, it has turned upward, and the histogram has turned from green to red, indicating that bearish momentum is weakening and bullish strength is increasing.
Resistance levels: The first resistance is the confluence of the 50-day moving average and the upper Bollinger Band, around $4897-$4948. If the bulls exert renewed pressure, new selling pressure may emerge at this level.
Support levels below: The first support is the Bollinger Band middle line/20-day moving average at approximately $4,649, while the 100-day moving average at approximately $4,713 has become a key defensive level for any pullback.
Expectations for a US-Iran reconciliation are rising.
Iranian Foreign Minister Abbas Araghchi said on Friday that the Strait of Hormuz has been fully open to all commercial vessels during the ceasefire, in line with the ceasefire agreement in Lebanon.
Following this news, crude oil prices plummeted, with West Texas Intermediate (WTI) crude falling to its lowest level since March 11. As of press time, WTI crude was trading around $81.50, down nearly 9% on the day.
US President Trump also signaled progress in diplomacy with Iran on Thursday: "There is a very high chance that we will reach an agreement with Iran, and it will be a good agreement," he told reporters at the White House, adding that the next round of negotiations could be held this weekend; if the two sides are close to reaching an agreement, he will consider extending the current ceasefire.
Despite some easing of tensions, gold remains range-bound. Expectations of a deal boosted market risk appetite, leading to gains in global stock markets and limiting capital inflows into gold. Meanwhile, a weaker dollar provided support for spot gold, limiting its downside potential.
The US dollar index (DXY) is trading around 97.98, having fallen to a new low in more than a month and is on track for its third consecutive week of decline.
Oil prices cool, and expectations of a Fed rate cut return.
Meanwhile, as the conflict with Iran may be nearing its end, oil prices have fallen, geopolitical risk premiums have diminished, and markets are reassessing the Federal Reserve's monetary policy path.
This eased market concerns about inflation and reignited expectations of a Federal Reserve rate cut this year. Lower interest rates typically benefit non-interest-bearing assets like gold.
Looking ahead, traders will be closely watching the progress of US-Iran negotiations this weekend, especially developments regarding the full reopening of the Strait of Hormuz. Trump stated that the US naval blockade against Iran will continue in full until a final agreement is reached.
According to a Reuters report citing Iran's official Fars News Agency, Iranian officials said that if the blockade continues, Tehran will consider it a violation of the ceasefire agreement and may close the Strait of Hormuz again.
On the data front, the US economic data is light, with no major releases scheduled. Market focus will shift to speeches by Federal Reserve officials in preparation for the quiet period leading up to the FOMC meeting on April 28-29.
Technical Analysis: Spot gold is consolidating, with Bollinger Bands narrowing; watch for a breakout.
(Spot gold daily chart source: FX678)
On the daily chart, spot gold is trading steadily above the Bollinger Band middle line/20-day simple moving average (SMA) at $4649, and has also risen above the 100-day moving average, indicating a short-term bullish trend. The narrowing Bollinger Bands suggest decreasing volatility, foreshadowing the start of a new upward move.
The Relative Strength Index (RSI14) is hovering around 55.4, which is above the neutral level of 50, reflecting that bullish momentum has recovered and has not yet entered the overbought zone. The rebound from the previous oversold area indicates that downward pressure has eased. The MACD indicator shows that although the DIFF line is still below the zero axis, it has turned upward, and the histogram has turned from green to red, indicating that bearish momentum is weakening and bullish strength is increasing.
Resistance levels: The first resistance is the confluence of the 50-day moving average and the upper Bollinger Band, around $4897-$4948. If the bulls exert renewed pressure, new selling pressure may emerge at this level.
Support levels below: The first support is the Bollinger Band middle line/20-day moving average at approximately $4,649, while the 100-day moving average at approximately $4,713 has become a key defensive level for any pullback.
- Risk Warning and Disclaimer
- The market involves risk, and trading may not be suitable for all investors. This article is for reference only and does not constitute personal investment advice, nor does it take into account certain users’ specific investment objectives, financial situation, or other needs. Any investment decisions made based on this information are at your own risk.