The suspected intervention has barely ended, and the US and Japan have already moved back up to 158. A fierce battle is likely to take place around this level tomorrow.
2026-05-05 20:52:46
On Tuesday (May 5th), after a period of sharp exchange rate fluctuations, the yen market exhibited an extremely delicate state of flux. As the calendar turns to May 2026, global investors are highly vigilant regarding the actions of the Japanese monetary authorities. The core logic of today's market sentiment lies in the fact that although the yen experienced an unusually rapid depreciation and hit multi-year lows earlier, with the suspected intervention now confirmed, the bulls and bears have entered a period of deep stalemate.

From a technical perspective, the USD/JPY pair fluctuated narrowly around 157.700 during the Asian and European sessions today. This reflects not only a correction of the previous sharp decline but also a cautious wait-and-see approach from the market as it considers the Bank of Japan's (BoJ) remaining "ammunition reserves." According to the latest calculations from a well-known institution, the relevant departments have already used about one-third of their intervention reserves in the past six months. While this pace of depletion has curbed the yen's one-sided decline to some extent, it has also raised questions about the market's future room for maneuver. However, this skepticism has not entirely translated into further shorting of the yen, as the options market remains filled with "fear."
From a macroeconomic perspective, fluctuations in Japanese government bond yields are becoming a core variable driving exchange rates. Currently, while the US-Japan interest rate differential has narrowed slightly, its absolute value remains high. The prevailing market view is that if Japanese government bond yields cannot establish a sustained upward trend, relying solely on "surgical" interventions like currency intervention will hardly reverse the yen's structural weakness. Especially under the framework of the International Monetary Fund (IMF) guidelines, frequent and large-scale interventions are subject to potential regulatory constraints. This has led the market to assess whether the Bank of Japan will adopt a more aggressive monetary policy adjustment, rather than simply selling foreign exchange, to stabilize the currency.
In the options market, a significant defensive stance is emerging. Data shows that although spot prices have stabilized somewhat, the premium of yen call options relative to put options (a one-month risk reversal indicator) remains high at around 1.85. This figure is significantly higher than the pre-intervention level of 0.55, indicating that participants in the derivatives market are not complacent due to the rebound in spot prices, but rather are more concerned about a potential second wave of retaliatory appreciation of the yen.
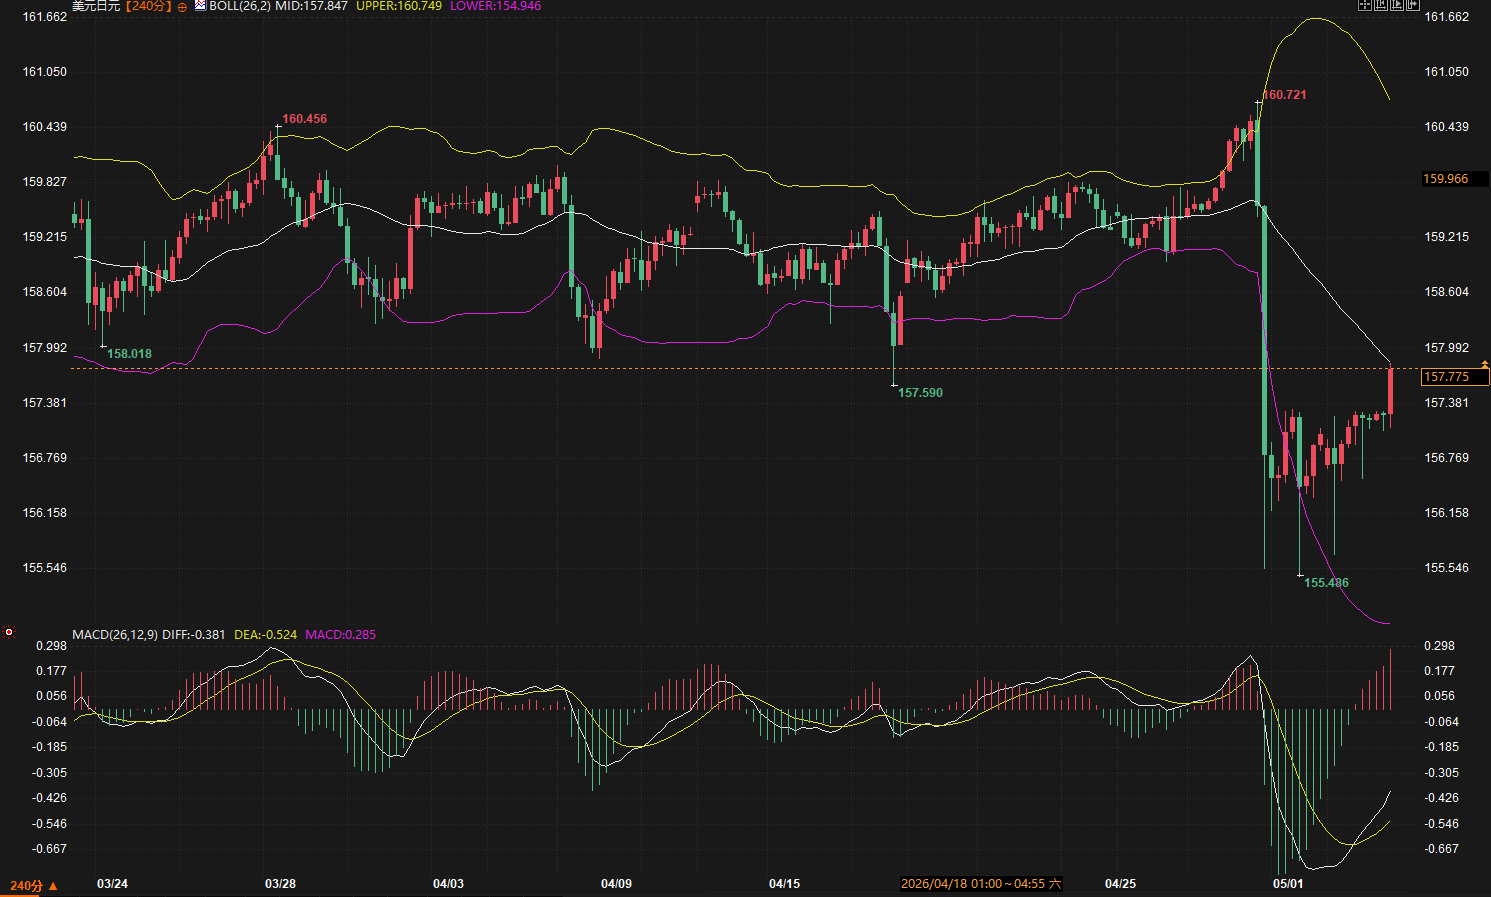
Turning to the technical analysis, the 240-minute candlestick chart provides a clear logical framework. After reaching a high of 160.721 in early May, the exchange rate experienced a sharp drop, hitting a low of 155.486. This move completely broke the previous consolidation pattern within the 157.5-160.5 range.
1. Moving averages and indicators: The MACD indicator has formed a golden cross at a low level below the zero axis, and the red momentum bars continue to expand, which suggests that there is a technical demand for an oversold rebound in the short term.
2. Bollinger Band Structure: The current price is at a critical juncture, testing the middle Bollinger Band (approximately 157.847). After a period of sharp expansion, the Bollinger Bands are gradually converging, indicating that the market is about to enter a period of consolidation and directional choice.
3. Trend Analysis: Although the DIFF line crossed the DEA line, it is still subject to the zero axis, indicating that although the medium-term bearish momentum has weakened, it has not reversed.
Support and resistance range prediction:
Reference Contract: USD/JPY Spot
Range logic: The upside is constrained by the conversion pressure of the lower edge of the previous oscillation range (around 158.000), while the downside is anchored at the key psychological support point at the beginning of the intervention.
Resistance range: 158.500 - 159.200. This range combines the upper Bollinger Band resistance and the previous area of dense trading volume.
Support range: 155.500 - 156.200. A break below the recent extreme of 155.486 could trigger a new round of panic selling and profit-taking.
Key points to watch during trading: Observe whether the price can effectively hold above 157.800. If the rebound is accompanied by shrinking trading volume, be wary of the risk of a "double bottom".
Looking ahead, the yen's exchange rate will enter a phase of psychological maneuvering characterized by "high frequency and low amplitude." On the policy front, the market is holding its breath awaiting the next signal regarding adjustments to the bond-buying program, and fluctuations in Japanese government bond yields will directly impact the foreign exchange market. Technically, if USD/JPY can effectively recover and stabilize above 158.000, it could alleviate short-term bearish pressure; conversely, if it encounters resistance at this level and falls back, it indicates that the lingering effects of intervention remain, and the market will return to testing the 155.000 support level. Considering the impact of potential external noise such as tariff comments, the yen's safe-haven status may be repriced in the coming weeks, and investors should pay close attention to anomalies in option volatility.
Question 1: Why did the premium for call options on the Japanese yen remain high after suspected intervention?
While currency intervention released short-term liquidity and dampened speculative trading, the performance of the options market reflects traders' "hedging fear." The one-month risk reversal indicator remained at 1.85, indicating that market participants were willing to pay a higher premium to buy yen call options to hedge against potential further sudden intervention. This suggests that the market does not believe the risk of intervention has completely dissipated.
Question 2: What is the transmission mechanism of Japanese bond yields to the current yen exchange rate?
The root cause of the yen's depreciation lies in the large interest rate differential. When Japanese government bond yields rise, the interest rate differential between the US and Japan narrows, attracting capital back to Japan or suppressing carry trade. If the JGB yields rise in tandem during intervention, it will provide fundamental support for the exchange rate; otherwise, a single currency buying action may only postpone the yen's fall below key levels.
Question 3: How to understand the importance of the Bollinger Band middle line in current technical analysis?
On the 240-minute chart, the Bollinger Band middle line (157.847) is not only a moving average indicator but also a watershed for the balance between bulls and bears. If the price rebounds from the lower band to this level and can break through and hold above it, it means that the market has shifted from "extreme oversold" to "range-bound trading." If it fails to break through multiple times, it confirms the resistance of the middle line, indicating that the rebound momentum is weakening and a second downward test of the 155.000 level may begin.
Question 4: What impact will international factors such as "tariff rhetoric" have on the yen?
Tariff rhetoric typically triggers market concerns about a tightening global trade environment, thereby boosting risk aversion. The Japanese yen has traditionally been considered a safe-haven asset; if the external environment becomes turbulent due to tariff expectations, it could lead to a withdrawal of cross-border capital from high-risk assets and a return to the yen. This would objectively reduce the pressure on the Bank of Japan to maintain exchange rate stability.
Question 5: Does a MACD golden cross mean that USD/JPY has reversed and entered a bullish trend?
This conclusion cannot be drawn at this time. Although the DIFF line has crossed above the DEA line and the red momentum bars are expanding, this only indicates a slowdown in the short-term decline and the existence of rebound momentum. Since the MACD indicator is still below the zero line overall, this is technically defined as a "rebound in a downtrend." Only when the indicator rises above the zero line and the price breaks through key resistance levels such as 159.500 with increased volume can a fundamental trend reversal be confirmed.
From a technical perspective, the USD/JPY pair fluctuated narrowly around 157.700 during the Asian and European sessions today. This reflects not only a correction of the previous sharp decline but also a cautious wait-and-see approach from the market as it considers the Bank of Japan's (BoJ) remaining "ammunition reserves." According to the latest calculations from a well-known institution, the relevant departments have already used about one-third of their intervention reserves in the past six months. While this pace of depletion has curbed the yen's one-sided decline to some extent, it has also raised questions about the market's future room for maneuver. However, this skepticism has not entirely translated into further shorting of the yen, as the options market remains filled with "fear."
In-depth analysis of fundamentals and technical aspects
From a macroeconomic perspective, fluctuations in Japanese government bond yields are becoming a core variable driving exchange rates. Currently, while the US-Japan interest rate differential has narrowed slightly, its absolute value remains high. The prevailing market view is that if Japanese government bond yields cannot establish a sustained upward trend, relying solely on "surgical" interventions like currency intervention will hardly reverse the yen's structural weakness. Especially under the framework of the International Monetary Fund (IMF) guidelines, frequent and large-scale interventions are subject to potential regulatory constraints. This has led the market to assess whether the Bank of Japan will adopt a more aggressive monetary policy adjustment, rather than simply selling foreign exchange, to stabilize the currency.
In the options market, a significant defensive stance is emerging. Data shows that although spot prices have stabilized somewhat, the premium of yen call options relative to put options (a one-month risk reversal indicator) remains high at around 1.85. This figure is significantly higher than the pre-intervention level of 0.55, indicating that participants in the derivatives market are not complacent due to the rebound in spot prices, but rather are more concerned about a potential second wave of retaliatory appreciation of the yen.
Turning to the technical analysis, the 240-minute candlestick chart provides a clear logical framework. After reaching a high of 160.721 in early May, the exchange rate experienced a sharp drop, hitting a low of 155.486. This move completely broke the previous consolidation pattern within the 157.5-160.5 range.
1. Moving averages and indicators: The MACD indicator has formed a golden cross at a low level below the zero axis, and the red momentum bars continue to expand, which suggests that there is a technical demand for an oversold rebound in the short term.
2. Bollinger Band Structure: The current price is at a critical juncture, testing the middle Bollinger Band (approximately 157.847). After a period of sharp expansion, the Bollinger Bands are gradually converging, indicating that the market is about to enter a period of consolidation and directional choice.
3. Trend Analysis: Although the DIFF line crossed the DEA line, it is still subject to the zero axis, indicating that although the medium-term bearish momentum has weakened, it has not reversed.
Support and resistance range prediction:
Reference Contract: USD/JPY Spot
Range logic: The upside is constrained by the conversion pressure of the lower edge of the previous oscillation range (around 158.000), while the downside is anchored at the key psychological support point at the beginning of the intervention.
Resistance range: 158.500 - 159.200. This range combines the upper Bollinger Band resistance and the previous area of dense trading volume.
Support range: 155.500 - 156.200. A break below the recent extreme of 155.486 could trigger a new round of panic selling and profit-taking.
Key points to watch during trading: Observe whether the price can effectively hold above 157.800. If the rebound is accompanied by shrinking trading volume, be wary of the risk of a "double bottom".
Future Trend Outlook
Looking ahead, the yen's exchange rate will enter a phase of psychological maneuvering characterized by "high frequency and low amplitude." On the policy front, the market is holding its breath awaiting the next signal regarding adjustments to the bond-buying program, and fluctuations in Japanese government bond yields will directly impact the foreign exchange market. Technically, if USD/JPY can effectively recover and stabilize above 158.000, it could alleviate short-term bearish pressure; conversely, if it encounters resistance at this level and falls back, it indicates that the lingering effects of intervention remain, and the market will return to testing the 155.000 support level. Considering the impact of potential external noise such as tariff comments, the yen's safe-haven status may be repriced in the coming weeks, and investors should pay close attention to anomalies in option volatility.
Frequently Asked Questions
Question 1: Why did the premium for call options on the Japanese yen remain high after suspected intervention?
While currency intervention released short-term liquidity and dampened speculative trading, the performance of the options market reflects traders' "hedging fear." The one-month risk reversal indicator remained at 1.85, indicating that market participants were willing to pay a higher premium to buy yen call options to hedge against potential further sudden intervention. This suggests that the market does not believe the risk of intervention has completely dissipated.
Question 2: What is the transmission mechanism of Japanese bond yields to the current yen exchange rate?
The root cause of the yen's depreciation lies in the large interest rate differential. When Japanese government bond yields rise, the interest rate differential between the US and Japan narrows, attracting capital back to Japan or suppressing carry trade. If the JGB yields rise in tandem during intervention, it will provide fundamental support for the exchange rate; otherwise, a single currency buying action may only postpone the yen's fall below key levels.
Question 3: How to understand the importance of the Bollinger Band middle line in current technical analysis?
On the 240-minute chart, the Bollinger Band middle line (157.847) is not only a moving average indicator but also a watershed for the balance between bulls and bears. If the price rebounds from the lower band to this level and can break through and hold above it, it means that the market has shifted from "extreme oversold" to "range-bound trading." If it fails to break through multiple times, it confirms the resistance of the middle line, indicating that the rebound momentum is weakening and a second downward test of the 155.000 level may begin.
Question 4: What impact will international factors such as "tariff rhetoric" have on the yen?
Tariff rhetoric typically triggers market concerns about a tightening global trade environment, thereby boosting risk aversion. The Japanese yen has traditionally been considered a safe-haven asset; if the external environment becomes turbulent due to tariff expectations, it could lead to a withdrawal of cross-border capital from high-risk assets and a return to the yen. This would objectively reduce the pressure on the Bank of Japan to maintain exchange rate stability.
Question 5: Does a MACD golden cross mean that USD/JPY has reversed and entered a bullish trend?
This conclusion cannot be drawn at this time. Although the DIFF line has crossed above the DEA line and the red momentum bars are expanding, this only indicates a slowdown in the short-term decline and the existence of rebound momentum. Since the MACD indicator is still below the zero line overall, this is technically defined as a "rebound in a downtrend." Only when the indicator rises above the zero line and the price breaks through key resistance levels such as 159.500 with increased volume can a fundamental trend reversal be confirmed.
- Risk Warning and Disclaimer
- The market involves risk, and trading may not be suitable for all investors. This article is for reference only and does not constitute personal investment advice, nor does it take into account certain users’ specific investment objectives, financial situation, or other needs. Any investment decisions made based on this information are at your own risk.