Gold Analysis: Non-Farm Payroll Data May Trigger Long-Awaited Breakout for Bulls
2026-05-08 20:16:38
On Friday (May 8), spot gold was trading at $4,719.75 per ounce in pre-market trading, up $32.57, or 0.69%, and is poised for further gains this week. The sharp decline in June WTI crude oil prices and the continued fall in 10-year US Treasury yields have led traders to believe that the Federal Reserve has room to cut interest rates, a positive catalyst the gold market has been waiting for for weeks.

The core reason for the rise in gold prices
Despite clashes between the US and Iran on Thursday, gold prices bucked the trend and rose. Market patterns in such geopolitical conflicts show that if both sides declare the situation has returned to normal within hours, the geopolitical risk premium in oil prices will quickly dissipate. June WTI crude oil is expected to fall by about 6% this week, and this decline will have a far greater impact on gold than any safe-haven buying.
This distinction is crucial for trading positioning: the rise in gold prices is not due to market panic, but rather a chain reaction triggered by the easing of inflation expectations caused by the decline in oil prices.
The decline in oil prices will simultaneously reduce inflationary pressures, and the cooling of inflation provides a reasonable basis for the Federal Reserve to cut interest rates later. This is the core logic of current gold trading. In the previous weeks, gold was continuously suppressed by interest rate expectations driven by energy prices. On every trading day with oil prices remaining high, gold struggled to find effective buying support. Now, market expectations have reversed, and buying is gradually entering the market.
The interest rate narrative has driven the decline in gold prices and is also fueling the current recovery.
Since the outbreak of the Middle East conflict at the end of February, spot gold has fallen by more than 10%. The interest rate narrative is the core driving factor for this decline: rising oil prices have pushed up inflation expectations, and high inflation expectations have forced the Federal Reserve to maintain the current interest rate level. The Federal Reserve's maintenance of high interest rates means that the yield on US Treasury bonds remains high. As a non-interest-bearing asset, gold is always at a disadvantage during the yield climbing cycle.
This current market narrative is gradually crumbling. On Friday, the 10-year US Treasury yield fell again, and the dollar index weakened in tandem, both providing support for gold. A weaker dollar allows overseas buyers to purchase gold with less local currency, while the falling yields have significantly weakened the main argument for short sellers this month. The logic behind gold's rise is relatively clear: lower yields and a weaker dollar are needed, and both are currently present—a favorable situation rarely seen in the current market environment.
Key points to watch: Yields and the US dollar
The yield on the 10-year US Treasury bond is a key indicator to watch. Earlier this month, when yields hit a three-week high, gold prices remained under pressure as investors favored interest-bearing assets, resulting in weak gold buying. Now, with yields falling and fund flows reversing, coupled with a weakening US dollar index, gold has received double upward momentum.
Key Test: Non-Farm Payroll Data
The number of initial jobless claims in the U.S. released on Thursday was 200,000, an increase of 10,000 from the previous week, but still lower than the market expectation of 206,000, indicating that the labor market remains resilient. This situation has a dual impact on gold: the stronger the job market, the less urgency the Federal Reserve will feel to cut interest rates, and the Fed's stance of maintaining its current interest rate policy will continue to put downward pressure on gold.
The monthly non-farm payrolls report will be released later today. Economists expect an increase of 62,000 jobs, far lower than the 178,000 in March, a figure already largely priced into by the market. If the data falls short of expectations, gold will gain new upward momentum, with declining US Treasury yields and a weakening dollar index opening up upward channels for gold. If the data exceeds expectations, expectations of an interest rate cut will be postponed again, putting immediate pressure on gold prices, and the 50-day moving average (currently around $4780.78) will revert from a target level to a key resistance level.
Amidst the backdrop of Middle East conflicts driving up energy costs and disrupting supply chains, the labor market has outperformed most expectations. This suggests that the Federal Reserve remains patient in maintaining its high-interest-rate policy. The core positive factor for gold bulls still awaits the complete realization of the chain of "falling oil prices → declining inflation → Fed policy shift." Currently, two factors in this chain are showing positive signs.
Technical Analysis
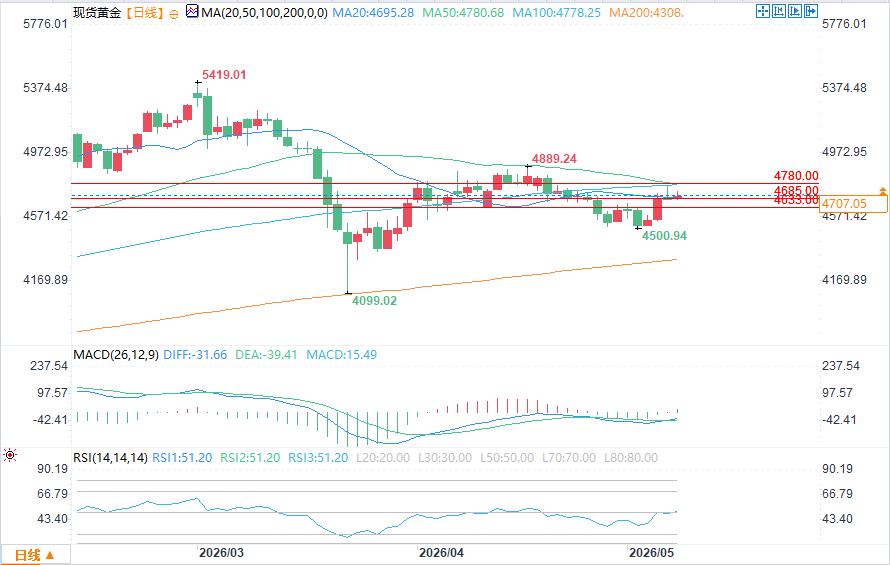
(Spot gold daily chart source: FX678)
Spot gold rose slightly in early trading on Friday, failing to confirm the potential bearish reversal pattern formed on Thursday. A break below $4,685.27 would confirm a short-term weakening trend and could test the secondary support level of $4,633.00.
On the upside, the first resistance level is the long-term 50% retracement level at $4744.34, which was tested on Thursday. The next potential resistance level is the 50-day moving average at $4780.78, which is both a resistance level and a potential trigger point for a faster upward move in gold prices. Even if gold prices break through the 50-day moving average, buyers will still face resistance in the $4850.68-$5028.04 retracement range, which includes the major high of $4891.54. A break above this level would confirm a shift to an upward trend based on the oscillator chart.
On the downside, after breaking below the $4633.00 pivot point, traders may target several support levels, including the long-term Fibonacci level of $4541.88, followed by the short-term retracement range of $4481.78-$4401.84. This range includes the swing low of $4501.04 and the key level of $4481.78, the latter being the dividing line between bull and bear markets; $4401.84 is the last support level before the 200-day moving average ($4308.73), which dominates the long-term trend.
The current market focus is on the 50-day moving average at $4780.78. Aggressive buyers need to actively absorb selling pressure at this level for gold prices to break through this indicator; otherwise, sellers will re-enter the market, pushing gold prices back down to the support zone. In strong markets, traders typically actively absorb selling pressure to drive up prices, and only when buyers decisively break through the 50-day moving average will gold prices establish a strong upward trend.
Passive buyers will wait for gold prices to fall back to at least $4,633.00. If this level holds, it will form a secondary higher low, and the initiative will return to aggressive buyers. If $4,633.00 fails to attract buying, gold prices may further test the support range of $4,541.88-$4,401.84.
As long as the 200-day moving average holds as support, buying will continue to enter the market during pullbacks; while sellers are expected to continue to exert pressure on the 50-day moving average until it is decisively broken.
Key Focus
The non-farm payroll data is the core event today; prior to this, other market fluctuations are merely noise. If the data is 62,000 or below, gold prices are expected to strongly challenge the 50-day moving average of $4,780.78. If the data is higher than expected, indicating a stronger-than-expected labor market, then the $4,685.27 level needs to be watched. A break below this level would confirm Thursday's bearish reversal pattern, and a sell-off could resume.
As long as oil prices continue to fall and the ceasefire agreement remains in place, the overall trend for gold will remain intact. Geopolitical news often creates opportunities for the market, and gold is currently seizing this opportunity to gradually rise.
The core reason for the rise in gold prices
Despite clashes between the US and Iran on Thursday, gold prices bucked the trend and rose. Market patterns in such geopolitical conflicts show that if both sides declare the situation has returned to normal within hours, the geopolitical risk premium in oil prices will quickly dissipate. June WTI crude oil is expected to fall by about 6% this week, and this decline will have a far greater impact on gold than any safe-haven buying.
This distinction is crucial for trading positioning: the rise in gold prices is not due to market panic, but rather a chain reaction triggered by the easing of inflation expectations caused by the decline in oil prices.
The decline in oil prices will simultaneously reduce inflationary pressures, and the cooling of inflation provides a reasonable basis for the Federal Reserve to cut interest rates later. This is the core logic of current gold trading. In the previous weeks, gold was continuously suppressed by interest rate expectations driven by energy prices. On every trading day with oil prices remaining high, gold struggled to find effective buying support. Now, market expectations have reversed, and buying is gradually entering the market.
The interest rate narrative has driven the decline in gold prices and is also fueling the current recovery.
Since the outbreak of the Middle East conflict at the end of February, spot gold has fallen by more than 10%. The interest rate narrative is the core driving factor for this decline: rising oil prices have pushed up inflation expectations, and high inflation expectations have forced the Federal Reserve to maintain the current interest rate level. The Federal Reserve's maintenance of high interest rates means that the yield on US Treasury bonds remains high. As a non-interest-bearing asset, gold is always at a disadvantage during the yield climbing cycle.
This current market narrative is gradually crumbling. On Friday, the 10-year US Treasury yield fell again, and the dollar index weakened in tandem, both providing support for gold. A weaker dollar allows overseas buyers to purchase gold with less local currency, while the falling yields have significantly weakened the main argument for short sellers this month. The logic behind gold's rise is relatively clear: lower yields and a weaker dollar are needed, and both are currently present—a favorable situation rarely seen in the current market environment.
Key points to watch: Yields and the US dollar
The yield on the 10-year US Treasury bond is a key indicator to watch. Earlier this month, when yields hit a three-week high, gold prices remained under pressure as investors favored interest-bearing assets, resulting in weak gold buying. Now, with yields falling and fund flows reversing, coupled with a weakening US dollar index, gold has received double upward momentum.
Key Test: Non-Farm Payroll Data
The number of initial jobless claims in the U.S. released on Thursday was 200,000, an increase of 10,000 from the previous week, but still lower than the market expectation of 206,000, indicating that the labor market remains resilient. This situation has a dual impact on gold: the stronger the job market, the less urgency the Federal Reserve will feel to cut interest rates, and the Fed's stance of maintaining its current interest rate policy will continue to put downward pressure on gold.
The monthly non-farm payrolls report will be released later today. Economists expect an increase of 62,000 jobs, far lower than the 178,000 in March, a figure already largely priced into by the market. If the data falls short of expectations, gold will gain new upward momentum, with declining US Treasury yields and a weakening dollar index opening up upward channels for gold. If the data exceeds expectations, expectations of an interest rate cut will be postponed again, putting immediate pressure on gold prices, and the 50-day moving average (currently around $4780.78) will revert from a target level to a key resistance level.
Amidst the backdrop of Middle East conflicts driving up energy costs and disrupting supply chains, the labor market has outperformed most expectations. This suggests that the Federal Reserve remains patient in maintaining its high-interest-rate policy. The core positive factor for gold bulls still awaits the complete realization of the chain of "falling oil prices → declining inflation → Fed policy shift." Currently, two factors in this chain are showing positive signs.
Technical Analysis
(Spot gold daily chart source: FX678)
Spot gold rose slightly in early trading on Friday, failing to confirm the potential bearish reversal pattern formed on Thursday. A break below $4,685.27 would confirm a short-term weakening trend and could test the secondary support level of $4,633.00.
On the upside, the first resistance level is the long-term 50% retracement level at $4744.34, which was tested on Thursday. The next potential resistance level is the 50-day moving average at $4780.78, which is both a resistance level and a potential trigger point for a faster upward move in gold prices. Even if gold prices break through the 50-day moving average, buyers will still face resistance in the $4850.68-$5028.04 retracement range, which includes the major high of $4891.54. A break above this level would confirm a shift to an upward trend based on the oscillator chart.
On the downside, after breaking below the $4633.00 pivot point, traders may target several support levels, including the long-term Fibonacci level of $4541.88, followed by the short-term retracement range of $4481.78-$4401.84. This range includes the swing low of $4501.04 and the key level of $4481.78, the latter being the dividing line between bull and bear markets; $4401.84 is the last support level before the 200-day moving average ($4308.73), which dominates the long-term trend.
The current market focus is on the 50-day moving average at $4780.78. Aggressive buyers need to actively absorb selling pressure at this level for gold prices to break through this indicator; otherwise, sellers will re-enter the market, pushing gold prices back down to the support zone. In strong markets, traders typically actively absorb selling pressure to drive up prices, and only when buyers decisively break through the 50-day moving average will gold prices establish a strong upward trend.
Passive buyers will wait for gold prices to fall back to at least $4,633.00. If this level holds, it will form a secondary higher low, and the initiative will return to aggressive buyers. If $4,633.00 fails to attract buying, gold prices may further test the support range of $4,541.88-$4,401.84.
As long as the 200-day moving average holds as support, buying will continue to enter the market during pullbacks; while sellers are expected to continue to exert pressure on the 50-day moving average until it is decisively broken.
Key Focus
The non-farm payroll data is the core event today; prior to this, other market fluctuations are merely noise. If the data is 62,000 or below, gold prices are expected to strongly challenge the 50-day moving average of $4,780.78. If the data is higher than expected, indicating a stronger-than-expected labor market, then the $4,685.27 level needs to be watched. A break below this level would confirm Thursday's bearish reversal pattern, and a sell-off could resume.
As long as oil prices continue to fall and the ceasefire agreement remains in place, the overall trend for gold will remain intact. Geopolitical news often creates opportunities for the market, and gold is currently seizing this opportunity to gradually rise.
- Risk Warning and Disclaimer
- The market involves risk, and trading may not be suitable for all investors. This article is for reference only and does not constitute personal investment advice, nor does it take into account certain users’ specific investment objectives, financial situation, or other needs. Any investment decisions made based on this information are at your own risk.