Copper prices have risen for six consecutive days, just one step away from the previous high! But one indicator is starting to narrow...
2026-05-11 18:34:51
Driven by both supply shortage concerns and a technical breakout, the global copper market exhibited extremely strong momentum today. LME three-month copper futures touched $13,637 per ton during London trading hours, reaching its highest level since January 29th of this year, and is on track for its longest winning streak of six days since December last year. Meanwhile, the domestic SHFE copper futures contract also performed strongly, closing at 104,620 yuan/ton during the day, up 0.9%, with an intraday high of 104,840 yuan/ton.

The core logic supporting the current strong copper price trend lies in the expectation of supply tightening. A well-known mining company recently announced that the full resumption of production at its flagship Grasberg mine will be postponed from the originally planned end of 2027 to the beginning of 2028. This news has undoubtedly exacerbated market anxiety about a concentrate supply gap over the next two years. Meanwhile, although demand concerns stemming from geopolitical conflicts persist, the latest data shows that factory inflation in China, the world's largest metal consumer, has exceeded expectations. This sends a positive signal to the market, suggesting that relevant economic stimulus policies are gradually taking effect, and demand resilience is beginning to recover with the support of macroeconomic data.
The current rise in copper prices is not simply driven by capital flows, but rather a result of a strong convergence of fundamental and technical factors. Technically, copper prices successfully broke through and stabilized above the key resistance level of $13,500 last Friday. This level had been repeatedly tested unsuccessfully since February of this year, creating strong psychological and technical resistance. A prominent institutional strategist pointed out that this technical breakout, against a complex macroeconomic backdrop, has been remarkably robust, attracting a large number of funds based on technical indicators to enter the market and go long. This "breakout effect" has continued today, with the price center of gravity continuing to shift upwards.
Looking back at historical trends, since copper prices began their upward trend from the low of $11,700 on March 20th, they have experienced two distinct shifts in pace. From early to late April, the market mainly fluctuated within the $13,000 to $13,480 range, digesting previous profit-taking. Towards the end of April, after bottoming out at $12,780, prices quickly began a new round of rapid upward movement. As of this evening Beijing time, the latest LME copper price has reached around $13,656.50, extremely close to the previous high.
From a micro-level technical perspective, the current market exhibits typical bullish momentum. On the 240-minute chart, the price is closely trading near the upper Bollinger Band (BOLL) at $13717.84. The middle band at $13417.03 has become a solid dynamic support level. Although the MACD indicator shows the DIFF and DEA lines still in a bullish alignment, with the DIFF value at 123.66 significantly higher than the DEA value at 100.66, it's worth noting that the MACD histogram's positive bars have narrowed from their previous peak. This reflects that while bullish momentum continues to be released, after six consecutive days of gains, the price faces some technical pullback pressure in the short term due to its proximity to the Bollinger Band resistance level.
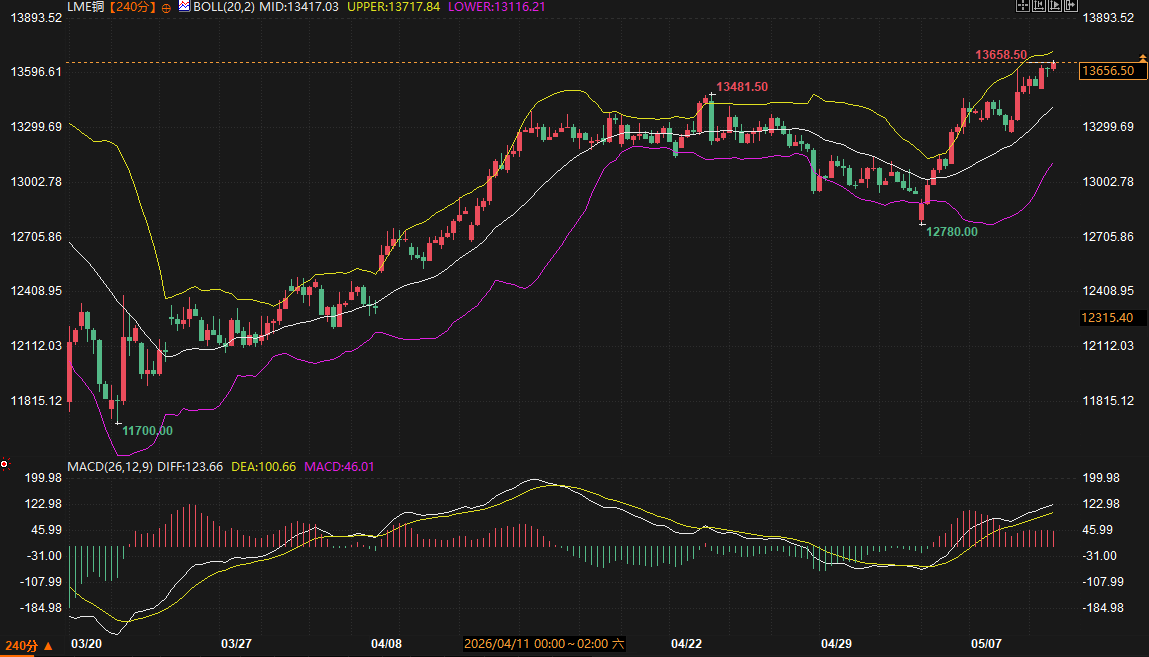
LME copper's recent price action hinges on the $13,500 to $13,750 range. If prices can hold above $13,500, the current upward trend will likely continue. Intraday focus should be on the resistance level at $13,717 (upper Bollinger Band); failure to break through with significant volume could lead to a pullback to the middle Bollinger Band at $13,417. For the SHFE copper main contract, the reference range is 104,000 to 105,500 yuan/ton. The recent high near 104,840 yuan is the primary hurdle for bulls to overcome. Overall, the tight physical market will continue to strongly support the market's price action.
Looking ahead, the focus of the copper market will revolve around the certainty of supply bottlenecks and the pace of demand recovery. Due to the lagging expansion progress of major mines, the expectation of tight supply is unlikely to be disproven in the short term. Although geopolitical tensions and tariff rhetoric may occasionally dampen bullish sentiment, the technical breakout has opened up upward potential.
Q: Why does the delayed commissioning of the Grasberg mine have such a direct impact on current copper prices?
A: Copper mine development has an extremely long cycle, and any delay in the progress of a large mine will directly change market expectations for the future supply and demand balance. As a top global copper and gold mine, Grasberg's delayed full-capacity operation means that tens of thousands of tons of capacity originally expected to be added to the market in 2027 will create a vacuum. This reduced certainty of long-term supply will be reflected in current price trends in advance through the discovery function of the futures market, reinforcing the market's "buy the dip" logic.
Q: How do you understand the relationship between the "technical breakdown" mentioned in the analysis and fund entry?
A: In professional trading, $13,500 is considered a significant dividing line between bullish and bearish sentiment. When prices repeatedly test this level and fail to break through, a large number of stop-loss orders or hedging positions accumulate. Once the price breaks through and stabilizes with a strong upward trend, the previously bearish funds are forced to close their positions and redeem, while trend-following funds (CTAs) will identify the opening of a new upward channel based on their algorithms and flood into the market. This combined force of funds often causes the price to break out of the consolidation zone in a short period of time, forming a continuous upward surge, as we are currently seeing in the six-day winning streak.
Q: What does the better-than-expected factory inflation data mean for copper, an industrial metal?
A: Strong Producer Price Index (PPI) data typically indicates a recovery in demand in the midstream processing sector and downstream manufacturing, or that companies are increasing their willingness to purchase raw materials. As the world's largest consumer of copper, China's improved macroeconomic data can effectively offset overseas demand concerns caused by geopolitical risks. This means that the rise in copper prices is not only supported by a supply gap but also backed by the logic of demand recovery, increasing the confidence that prices will stabilize at high levels.
Q: The article mentions that the MACD histogram is narrowing but the DIFF is still higher than the DEA. Is there any contradiction in this when judging the trend?
A: This is not contradictory, but rather reflects a change in the upward slope. A positive DIFF value above DEA indicates an absolute bullish market; while a narrowing histogram is an early signal of "top divergence," suggesting that the rate of price increase is slowing and momentum is weakening. When the price is trading close to the upper Bollinger Band, this signal reminds the market that although the overall trend is upward, it's not advisable to blindly chase highs in the short term, and investors should be wary of potential pullbacks caused by profit-taking.
Q: What is the path of geopolitical events' impact on copper prices? Why does the article mention that risk aversion can affect bullish sentiment?
A: Geopolitical tensions are typically a double-edged sword. On the one hand, they can lead to higher energy prices, thereby increasing copper smelting costs and supporting prices. On the other hand, excessive tensions can cause the market to become pessimistic about the global economic growth outlook, leading to concerns about a significant contraction in industrial copper demand. Current market performance indicates that supply-side issues have outweighed demand concerns stemming from geopolitical factors. However, macroeconomic fluctuations triggered by rhetoric such as tariffs remain a significant and unpredictable disruptive factor that traders must carefully analyze.
The core logic supporting the current strong copper price trend lies in the expectation of supply tightening. A well-known mining company recently announced that the full resumption of production at its flagship Grasberg mine will be postponed from the originally planned end of 2027 to the beginning of 2028. This news has undoubtedly exacerbated market anxiety about a concentrate supply gap over the next two years. Meanwhile, although demand concerns stemming from geopolitical conflicts persist, the latest data shows that factory inflation in China, the world's largest metal consumer, has exceeded expectations. This sends a positive signal to the market, suggesting that relevant economic stimulus policies are gradually taking effect, and demand resilience is beginning to recover with the support of macroeconomic data.
Looking at the deeper logical chain
The current rise in copper prices is not simply driven by capital flows, but rather a result of a strong convergence of fundamental and technical factors. Technically, copper prices successfully broke through and stabilized above the key resistance level of $13,500 last Friday. This level had been repeatedly tested unsuccessfully since February of this year, creating strong psychological and technical resistance. A prominent institutional strategist pointed out that this technical breakout, against a complex macroeconomic backdrop, has been remarkably robust, attracting a large number of funds based on technical indicators to enter the market and go long. This "breakout effect" has continued today, with the price center of gravity continuing to shift upwards.
Looking back at historical trends, since copper prices began their upward trend from the low of $11,700 on March 20th, they have experienced two distinct shifts in pace. From early to late April, the market mainly fluctuated within the $13,000 to $13,480 range, digesting previous profit-taking. Towards the end of April, after bottoming out at $12,780, prices quickly began a new round of rapid upward movement. As of this evening Beijing time, the latest LME copper price has reached around $13,656.50, extremely close to the previous high.
From a micro-level technical perspective, the current market exhibits typical bullish momentum. On the 240-minute chart, the price is closely trading near the upper Bollinger Band (BOLL) at $13717.84. The middle band at $13417.03 has become a solid dynamic support level. Although the MACD indicator shows the DIFF and DEA lines still in a bullish alignment, with the DIFF value at 123.66 significantly higher than the DEA value at 100.66, it's worth noting that the MACD histogram's positive bars have narrowed from their previous peak. This reflects that while bullish momentum continues to be released, after six consecutive days of gains, the price faces some technical pullback pressure in the short term due to its proximity to the Bollinger Band resistance level.
Support and resistance range prediction
LME copper's recent price action hinges on the $13,500 to $13,750 range. If prices can hold above $13,500, the current upward trend will likely continue. Intraday focus should be on the resistance level at $13,717 (upper Bollinger Band); failure to break through with significant volume could lead to a pullback to the middle Bollinger Band at $13,417. For the SHFE copper main contract, the reference range is 104,000 to 105,500 yuan/ton. The recent high near 104,840 yuan is the primary hurdle for bulls to overcome. Overall, the tight physical market will continue to strongly support the market's price action.
Looking ahead, the focus of the copper market will revolve around the certainty of supply bottlenecks and the pace of demand recovery. Due to the lagging expansion progress of major mines, the expectation of tight supply is unlikely to be disproven in the short term. Although geopolitical tensions and tariff rhetoric may occasionally dampen bullish sentiment, the technical breakout has opened up upward potential.
Frequently Asked Questions
Q: Why does the delayed commissioning of the Grasberg mine have such a direct impact on current copper prices?
A: Copper mine development has an extremely long cycle, and any delay in the progress of a large mine will directly change market expectations for the future supply and demand balance. As a top global copper and gold mine, Grasberg's delayed full-capacity operation means that tens of thousands of tons of capacity originally expected to be added to the market in 2027 will create a vacuum. This reduced certainty of long-term supply will be reflected in current price trends in advance through the discovery function of the futures market, reinforcing the market's "buy the dip" logic.
Q: How do you understand the relationship between the "technical breakdown" mentioned in the analysis and fund entry?
A: In professional trading, $13,500 is considered a significant dividing line between bullish and bearish sentiment. When prices repeatedly test this level and fail to break through, a large number of stop-loss orders or hedging positions accumulate. Once the price breaks through and stabilizes with a strong upward trend, the previously bearish funds are forced to close their positions and redeem, while trend-following funds (CTAs) will identify the opening of a new upward channel based on their algorithms and flood into the market. This combined force of funds often causes the price to break out of the consolidation zone in a short period of time, forming a continuous upward surge, as we are currently seeing in the six-day winning streak.
Q: What does the better-than-expected factory inflation data mean for copper, an industrial metal?
A: Strong Producer Price Index (PPI) data typically indicates a recovery in demand in the midstream processing sector and downstream manufacturing, or that companies are increasing their willingness to purchase raw materials. As the world's largest consumer of copper, China's improved macroeconomic data can effectively offset overseas demand concerns caused by geopolitical risks. This means that the rise in copper prices is not only supported by a supply gap but also backed by the logic of demand recovery, increasing the confidence that prices will stabilize at high levels.
Q: The article mentions that the MACD histogram is narrowing but the DIFF is still higher than the DEA. Is there any contradiction in this when judging the trend?
A: This is not contradictory, but rather reflects a change in the upward slope. A positive DIFF value above DEA indicates an absolute bullish market; while a narrowing histogram is an early signal of "top divergence," suggesting that the rate of price increase is slowing and momentum is weakening. When the price is trading close to the upper Bollinger Band, this signal reminds the market that although the overall trend is upward, it's not advisable to blindly chase highs in the short term, and investors should be wary of potential pullbacks caused by profit-taking.
Q: What is the path of geopolitical events' impact on copper prices? Why does the article mention that risk aversion can affect bullish sentiment?
A: Geopolitical tensions are typically a double-edged sword. On the one hand, they can lead to higher energy prices, thereby increasing copper smelting costs and supporting prices. On the other hand, excessive tensions can cause the market to become pessimistic about the global economic growth outlook, leading to concerns about a significant contraction in industrial copper demand. Current market performance indicates that supply-side issues have outweighed demand concerns stemming from geopolitical factors. However, macroeconomic fluctuations triggered by rhetoric such as tariffs remain a significant and unpredictable disruptive factor that traders must carefully analyze.
- Risk Warning and Disclaimer
- The market involves risk, and trading may not be suitable for all investors. This article is for reference only and does not constitute personal investment advice, nor does it take into account certain users’ specific investment objectives, financial situation, or other needs. Any investment decisions made based on this information are at your own risk.