Oil prices fuel inflation expectations, causing spot gold to fall.
2026-05-11 19:31:54
On Monday (May 11), spot gold (XAU/USD) fell more than 1% during the European session, hitting a low of around 4648 during the Asian session. The sell-off began with Trump's public statement that "Iran's latest peace proposal is completely unacceptable." Affected by this escalating geopolitical risk, Brent crude oil prices rebounded quickly to above $103 per barrel, with inflation trading logic once again dominating market sentiment, and funds flowing from non-interest-bearing assets like gold to inflation-hedging assets. Last week, gold enjoyed a brief window of opportunity thanks to a temporary pullback in oil prices and a slight decline in US Treasury yields, accumulating a 3.72% weekly gain. However, this window quickly closed on Monday morning, with bulls failing to hold onto key gains, and the market returning to a weak pattern.

Technical Analysis
On Monday morning, spot gold continued its downward trend, hitting a new low for the second consecutive trading day. 4764.67 became the new major resistance level, shifting the short-term trading range down to 4500.94-4764.67. From a retracement perspective, the primary downside target is in the 4653.21-4598.58 range. This range is the core battleground for short-term bulls and bears, where bulls may take advantage of the dips to attempt to build a secondary high bottom pattern to maintain the previous rebound trend.
If the key support level of 4598.58 is breached, a clear technical breakdown signal will emerge, and gold prices may further decline to the long-term Fibonacci retracement level of 4553.55. A deeper key support lies near the previous low of 4500.94, a widely recognized dividing line between bullish and bearish sentiment—holding above this level would mean gold remains in a medium-term rebound channel; a break below it would indicate a potential weakening trend and could trigger stop-loss selling.
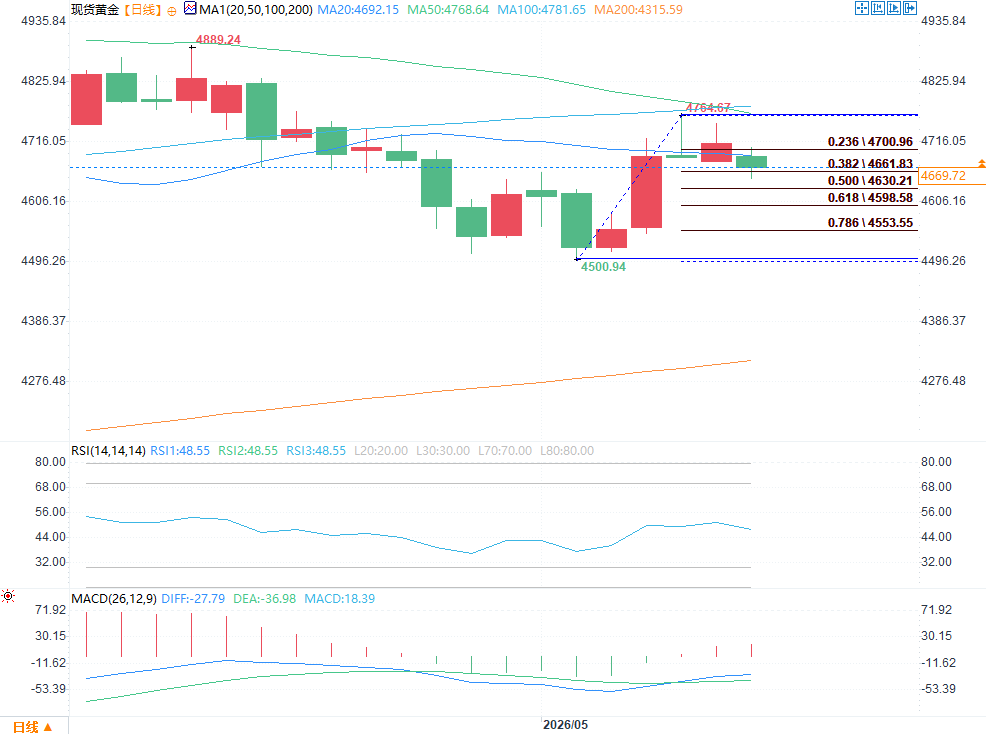
(Spot gold daily chart source: FX678)
Regarding resistance levels, the first resistance is at 4700.96 (0.236 Fibonacci level), followed by the 50-day moving average at 4768.62. This moving average currently forms a resistance zone with the previous high of 4764.67. There is no clear Fibonacci resistance level above that level yet, and we need to pay attention to the subsequent trend.
On Monday morning, sellers dominated, and the price action within the 4653.21-4598.58 range should be closely watched: if gold prices hold above 4653.21, it indicates a return of buying interest at lower levels, potentially restarting short-term rebound momentum with a target of the 4700.96-4764.67 resistance range; however, a break below 4598.58 would significantly intensify selling pressure, potentially leading to further declines towards the 4553.55 level and the previous low near 4500.94 support.
To avoid interference from signals at dense pullback levels, pay close attention to the moving average system: the 50-day moving average at 4768.62 is a strong short-term resistance, while the 200-day moving average at 4315.58 is a solid long-term support. The midpoint between these two moving averages, approximately 4542.10, is the current dividing line between market strength and weakness. Gold prices are currently trading above this midpoint, slightly bullish in the short term, but the overall trading logic remains focused on "selling on rallies and buying on pullbacks" within a range, until clear bullish or bearish news breaks the current consolidation pattern.
Currently, gold prices are consolidating with decreasing volume between overlapping retracement levels and the moving average system. This type of tight price structure is often a consolidation phase before a major market move. Once the key range is broken, it may trigger a sharp trend.
Oil prices – inflation transmission chain, gold under pressure throughout the year
Brent crude oil prices surged on Monday after Trump rejected Iran's peace proposal. This transmission logic—"rising oil prices → increased inflation expectations → Federal Reserve maintaining interest rates → rising US Treasury yields → decreased attractiveness of gold"—has become the core contradiction driving gold's price movement throughout the year. Within this chain, investors are more inclined to choose interest-bearing assets like US Treasuries rather than non-interest-bearing gold. Last week, this chain briefly reversed, with gold prices surging 3.72%, but Monday saw a return to bearish sentiment, highlighting the fragility of gold's current bullish foundation.
On Monday, the yield on the 10-year US Treasury note climbed to around 4.39%, and the yield on the 2-year Treasury note approached 3.92%. Such high yields significantly increased the cost of holding gold, and its non-interest-bearing asset nature made it difficult to attract new buying interest. The non-farm payroll data released last Friday far exceeded market expectations, further reinforcing expectations that the Federal Reserve would not cut interest rates in the short term. The market has now largely ruled out the possibility of a rate cut this year, and some institutions have even begun pricing in a potential rate hike scenario in 2027 if inflation becomes stickier than expected. This expectation is sufficient to suppress aggressive demand for gold.
A stronger dollar adds further pressure to gold.
Boosted by strong employment data, the US dollar index rebounded to near the 98.00 level on Monday, with major non-US currencies such as the euro, yen, and pound sterling weakening against the dollar, highlighting both the dollar's safe-haven appeal and interest rate advantage. The stronger dollar significantly increased the cost of purchasing spot gold (XAU/USD) for non-US investors, leading to a rapid contraction in overseas market demand. Gold is currently facing the dual pressures of rising yields and a stronger dollar, a "double whammy" situation mirroring the market environment that triggered the sharp drop in gold prices at the beginning of the year, and unlikely to see fundamental relief in the short term.
Key this week: US CPI data sets the direction
Tuesday's release of the U.S. Consumer Price Index (CPI) will be a key event determining the short-term trend of gold, as its performance will directly rewrite the market's pricing logic for inflation and Federal Reserve policy.
If inflation data exceeds expectations (hot data), short sellers will dominate the market, and US Treasury yields and the US dollar index are expected to strengthen in tandem. Gold prices may accelerate their decline to test support levels near 4553.55 and the previous low of 4500.94. Once these levels are broken, the medium-term rebound pattern for gold will be weakened.
If inflation data falls short of expectations (a weaker-than-expected figure), bulls will gain some breathing room, US Treasury yields may fall, the dollar may lose its upward momentum, and gold prices are expected to return to the key level of 4653.21, and then challenge the 50-day moving average resistance of 4768.62.
Variable: Meeting between Chinese and US leaders
This week, Trump and the Chinese President will hold an important meeting, covering key areas such as Iran, trade policy, artificial intelligence development, and the shipping security crisis in the Strait of Hormuz. The outcome of this meeting will be a significant variable affecting oil and gold prices.
If the meeting releases positive signals of easing tensions in the Middle East, geopolitical risk premiums will significantly diminish, oil prices may fall accordingly, inflationary pressures will ease, and safe-haven buying of gold is expected to return. If it releases negative signals, risk premiums in the oil market will rise rapidly, and gold will face downward pressure again through the yield transmission channel.
Key Focus
The key observation range for Monday is 4653.21-4598.58: A sustained move above this range indicates active buying on dips, suggesting a continuation of the short-term consolidation pattern; a break below 4598.58 would extend the selling pressure to 4553.55, potentially even testing the previous low near 4500.94. The 50-day moving average at 4768.62 represents strong short-term resistance, while the 200-day moving average at 4315.58 provides long-term support. Until Tuesday's CPI data release, price fluctuations within this range are considered consolidation, and the market awaits key data to provide a clear breakout direction.
At 19:30 Beijing time, spot gold was trading at $4,670.46 per ounce, down 0.95%.
Technical Analysis
On Monday morning, spot gold continued its downward trend, hitting a new low for the second consecutive trading day. 4764.67 became the new major resistance level, shifting the short-term trading range down to 4500.94-4764.67. From a retracement perspective, the primary downside target is in the 4653.21-4598.58 range. This range is the core battleground for short-term bulls and bears, where bulls may take advantage of the dips to attempt to build a secondary high bottom pattern to maintain the previous rebound trend.
If the key support level of 4598.58 is breached, a clear technical breakdown signal will emerge, and gold prices may further decline to the long-term Fibonacci retracement level of 4553.55. A deeper key support lies near the previous low of 4500.94, a widely recognized dividing line between bullish and bearish sentiment—holding above this level would mean gold remains in a medium-term rebound channel; a break below it would indicate a potential weakening trend and could trigger stop-loss selling.
(Spot gold daily chart source: FX678)
Regarding resistance levels, the first resistance is at 4700.96 (0.236 Fibonacci level), followed by the 50-day moving average at 4768.62. This moving average currently forms a resistance zone with the previous high of 4764.67. There is no clear Fibonacci resistance level above that level yet, and we need to pay attention to the subsequent trend.
On Monday morning, sellers dominated, and the price action within the 4653.21-4598.58 range should be closely watched: if gold prices hold above 4653.21, it indicates a return of buying interest at lower levels, potentially restarting short-term rebound momentum with a target of the 4700.96-4764.67 resistance range; however, a break below 4598.58 would significantly intensify selling pressure, potentially leading to further declines towards the 4553.55 level and the previous low near 4500.94 support.
To avoid interference from signals at dense pullback levels, pay close attention to the moving average system: the 50-day moving average at 4768.62 is a strong short-term resistance, while the 200-day moving average at 4315.58 is a solid long-term support. The midpoint between these two moving averages, approximately 4542.10, is the current dividing line between market strength and weakness. Gold prices are currently trading above this midpoint, slightly bullish in the short term, but the overall trading logic remains focused on "selling on rallies and buying on pullbacks" within a range, until clear bullish or bearish news breaks the current consolidation pattern.
Currently, gold prices are consolidating with decreasing volume between overlapping retracement levels and the moving average system. This type of tight price structure is often a consolidation phase before a major market move. Once the key range is broken, it may trigger a sharp trend.
Oil prices – inflation transmission chain, gold under pressure throughout the year
Brent crude oil prices surged on Monday after Trump rejected Iran's peace proposal. This transmission logic—"rising oil prices → increased inflation expectations → Federal Reserve maintaining interest rates → rising US Treasury yields → decreased attractiveness of gold"—has become the core contradiction driving gold's price movement throughout the year. Within this chain, investors are more inclined to choose interest-bearing assets like US Treasuries rather than non-interest-bearing gold. Last week, this chain briefly reversed, with gold prices surging 3.72%, but Monday saw a return to bearish sentiment, highlighting the fragility of gold's current bullish foundation.
On Monday, the yield on the 10-year US Treasury note climbed to around 4.39%, and the yield on the 2-year Treasury note approached 3.92%. Such high yields significantly increased the cost of holding gold, and its non-interest-bearing asset nature made it difficult to attract new buying interest. The non-farm payroll data released last Friday far exceeded market expectations, further reinforcing expectations that the Federal Reserve would not cut interest rates in the short term. The market has now largely ruled out the possibility of a rate cut this year, and some institutions have even begun pricing in a potential rate hike scenario in 2027 if inflation becomes stickier than expected. This expectation is sufficient to suppress aggressive demand for gold.
A stronger dollar adds further pressure to gold.
Boosted by strong employment data, the US dollar index rebounded to near the 98.00 level on Monday, with major non-US currencies such as the euro, yen, and pound sterling weakening against the dollar, highlighting both the dollar's safe-haven appeal and interest rate advantage. The stronger dollar significantly increased the cost of purchasing spot gold (XAU/USD) for non-US investors, leading to a rapid contraction in overseas market demand. Gold is currently facing the dual pressures of rising yields and a stronger dollar, a "double whammy" situation mirroring the market environment that triggered the sharp drop in gold prices at the beginning of the year, and unlikely to see fundamental relief in the short term.
Key this week: US CPI data sets the direction
Tuesday's release of the U.S. Consumer Price Index (CPI) will be a key event determining the short-term trend of gold, as its performance will directly rewrite the market's pricing logic for inflation and Federal Reserve policy.
If inflation data exceeds expectations (hot data), short sellers will dominate the market, and US Treasury yields and the US dollar index are expected to strengthen in tandem. Gold prices may accelerate their decline to test support levels near 4553.55 and the previous low of 4500.94. Once these levels are broken, the medium-term rebound pattern for gold will be weakened.
If inflation data falls short of expectations (a weaker-than-expected figure), bulls will gain some breathing room, US Treasury yields may fall, the dollar may lose its upward momentum, and gold prices are expected to return to the key level of 4653.21, and then challenge the 50-day moving average resistance of 4768.62.
Variable: Meeting between Chinese and US leaders
This week, Trump and the Chinese President will hold an important meeting, covering key areas such as Iran, trade policy, artificial intelligence development, and the shipping security crisis in the Strait of Hormuz. The outcome of this meeting will be a significant variable affecting oil and gold prices.
If the meeting releases positive signals of easing tensions in the Middle East, geopolitical risk premiums will significantly diminish, oil prices may fall accordingly, inflationary pressures will ease, and safe-haven buying of gold is expected to return. If it releases negative signals, risk premiums in the oil market will rise rapidly, and gold will face downward pressure again through the yield transmission channel.
Key Focus
The key observation range for Monday is 4653.21-4598.58: A sustained move above this range indicates active buying on dips, suggesting a continuation of the short-term consolidation pattern; a break below 4598.58 would extend the selling pressure to 4553.55, potentially even testing the previous low near 4500.94. The 50-day moving average at 4768.62 represents strong short-term resistance, while the 200-day moving average at 4315.58 provides long-term support. Until Tuesday's CPI data release, price fluctuations within this range are considered consolidation, and the market awaits key data to provide a clear breakout direction.
At 19:30 Beijing time, spot gold was trading at $4,670.46 per ounce, down 0.95%.
- Risk Warning and Disclaimer
- The market involves risk, and trading may not be suitable for all investors. This article is for reference only and does not constitute personal investment advice, nor does it take into account certain users’ specific investment objectives, financial situation, or other needs. Any investment decisions made based on this information are at your own risk.