With the CPI set at 3.8%, gold and interest rates haven't collapsed, indicating that the market had already priced in half of the gains.
2026-05-12 20:42:33
On Tuesday (May 12), the US April CPI data was released as scheduled at 8:30 PM Beijing time. The data showed that the US April unadjusted CPI rose to 333.020, with an annual rate of 3.8%, higher than the market expectation of 3.7%, the highest level since May 2023; the core CPI (excluding food and energy) annual rate was 2.8%, also higher than the expected 2.7%. On a monthly basis, the CPI rose 0.6%, in line with expectations, while the core CPI rose 0.4%, slightly higher than the expected 0.3%.

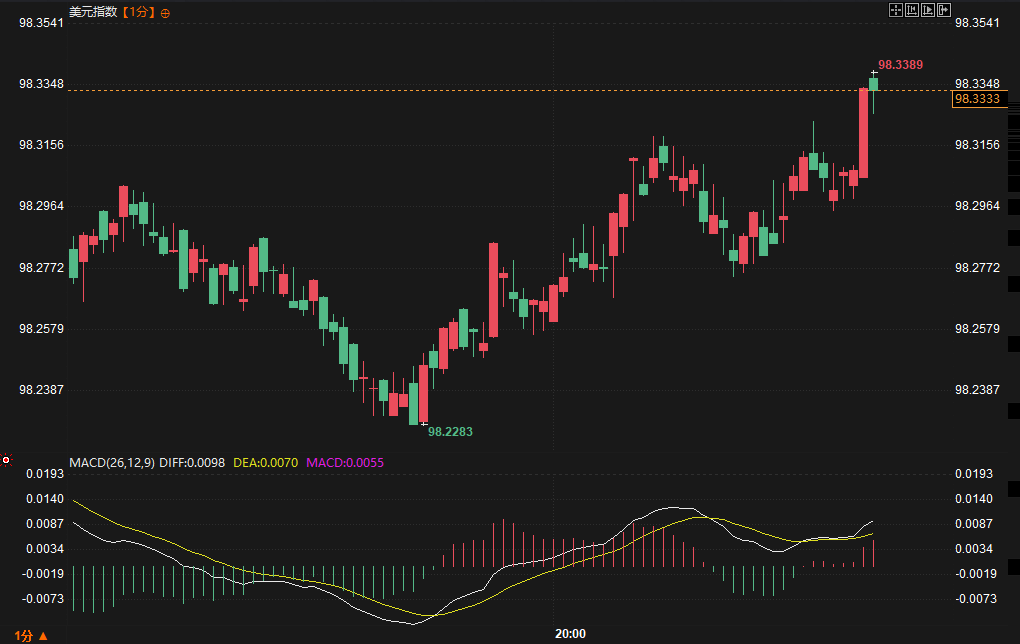
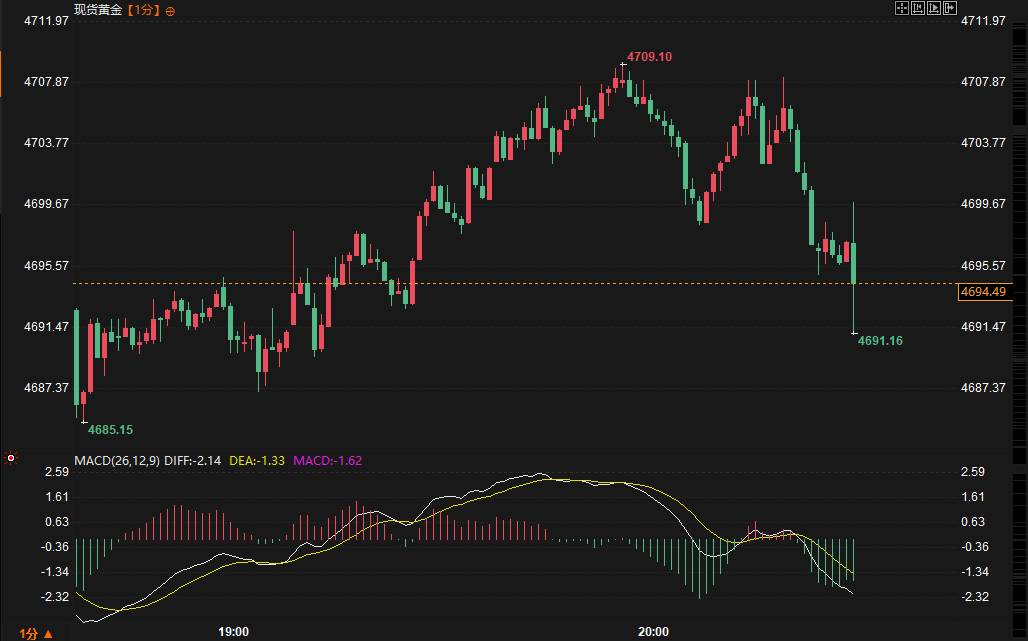
Prior to the data release, the market had already anticipated a rise in inflation, primarily linked to factors related to energy prices. Following the data release, spot gold fell slightly by about $8, while US short-term interest rate futures recovered some of their earlier losses, indicating a divergence in market reaction to the data.
Entering May 2026, the global market remains in an environment intertwined with geopolitical factors and macroeconomic data. The ongoing situation in the Middle East continues to impact energy price transmission, becoming a significant backdrop to recent inflationary pressures. The Federal Reserve's policy path is highly dependent on inflation trends, and market expectations for monetary policy adjustments this year have gradually become more cautious.
Prior to the CPI release, institutional investors generally expected a moderate rebound in April's data, primarily driven by the energy component. Previews from prominent financial institutions and analysts largely pointed to an annualized rate of around 3.7%, emphasizing energy prices as the main driver while also noting potential adjustments in housing-related sub-items. Retail investor discussions were more diverse, with some expressing concern about the risk of the data exceeding expectations. However, the overall atmosphere remained largely one of observation, with no extreme consensus yet formed.
The CPI data this time was higher than the market consensus, mainly reflected in the annual rate. Looking at the sub-categories, energy prices rose 3.8% month-on-month, with gasoline prices rising 5.4%, which was the main contributor to overall inflation; food prices rose 0.5% month-on-month, and housing prices rose 0.7% month-on-month. These changes directly correspond to recent dynamics in the energy market.
Historically, the 3.8% annualized rate is back to the mid-2023 range, a stark contrast to previous lows. Latest quotes show core inflation also slightly exceeding expectations, indicating broad-based price pressures. The market's immediate reaction after the announcement was relatively restrained: gold, as a traditional safe-haven asset, fell slightly, reflecting a marginal adjustment in real interest rate expectations; the recovery in interest rate futures suggests that traders' repricing of the Fed's subsequent path has not seen a dramatic shift.
A clear contrast emerged in institutional perspectives before and after the data release. Prior to the release, most institutional analyses focused on the temporary nature of energy-driven inflation, anticipating that core inflation would remain under control. After the data release, some institutions quickly pointed out that while the overall figure exceeded expectations, the deviations in key sub-items were limited, and the real income data showed a month-on-month improvement (-0.2%), indicating some buffer on the household side. Institutional accounts tended to emphasize the interpretation of "primarily energy-driven inflation," avoiding overemphasizing the signal of policy tightening.
Retail investor opinions showed greater volatility. Before the data release, discussions among retail investors ranged from optimism about the "peak of inflation" to concerns about the sustainability of energy prices. After the data release, some retail investors quickly shifted their focus to the possibility of an increased probability of a Fed rate hike, while others believed that the core indicator remained around 2.8%, not yet outside its previous trading range. This discrepancy in expectations reflects a difference in information interpretation: institutions focus more on the breakdown of data structure, while retail investors are more sensitive to the overall figures.
From a technical perspective, related instruments mainly maintained their original trading range before and after the data release, without any trend breakout. Short-term bullish and bearish forces indicate that energy-related factors are providing support for some assets, while interest rate-sensitive instruments are facing some pressure. Overall, the market remains in a dynamic equilibrium driven by data.
Based on current data, the sticky nature of the inflation path may persist for some time, with energy factors remaining a key variable. The market will subsequently focus on the Federal Reserve's statements regarding the data and the verification of other economic indicators. Logically, asset prices may continue to fluctuate around data interpretations in the short term, while the medium-term outlook depends on whether a clear inflection point in the inflation trend emerges.
From an interconnected perspective, the correlation between the US dollar index, bond yields, and commodity prices will continue to play a role. If subsequent data continues to validate current levels, interest rate expectations may remain relatively stable; conversely, if energy prices show marginal easing, market pricing in policy flexibility may gradually recover. Overall, the market will continue to be data-sensitive, and volatility may remain relatively high during key event windows.
Q: What are the main driving factors behind the better-than-expected CPI data?
A: The main contributor was the energy component, particularly the significant month-on-month increase in gasoline prices, which is directly related to the energy market dynamics under the Middle East situation. While core CPI also slightly exceeded expectations, the deviation was smaller than the overall figure, and sub-categories such as housing showed a stable trend.
Q: Why did gold prices fall slightly after the data was released?
A: As a non-yielding asset, gold is quite sensitive to expectations of real interest rates. Higher-than-expected inflation data led to a slight adjustment in market pricing of monetary policy path, resulting in a short-term decline in safe-haven buying. However, the overall decline was limited, indicating that there was no panic selling in the market.
Q: Where do the differences in opinions between institutional and retail investors lie before and after the data is released?
A: Institutional investors focus more on data structure analysis and tend to attribute better-than-expected results to temporary energy factors; retail investors, on the other hand, react more directly to the overall figures, with some amplifying the risk of policy tightening. Institutional interpretations remained relatively stable before and after the data release, while retail investor sentiment fluctuated more significantly.
Q: What impact will this data have on the Federal Reserve's policy expectations?
A: Market expectations for policy adjustments this year have become more cautious, but the recovery in short-term interest rate futures indicates that traders have not immediately shifted to pricing in extreme tightening. Further observation of other economic indicators is needed.
Q: What variables should we pay close attention to in the future market trend?
A: We need to continuously monitor energy price trends, subsequent inflation data, and policy communications from major economies. The market will revolve around marginal changes in these variables, and volatility is expected to continue to dominate short-term price movements.
Prior to the data release, the market had already anticipated a rise in inflation, primarily linked to factors related to energy prices. Following the data release, spot gold fell slightly by about $8, while US short-term interest rate futures recovered some of their earlier losses, indicating a divergence in market reaction to the data.
Market Background
Entering May 2026, the global market remains in an environment intertwined with geopolitical factors and macroeconomic data. The ongoing situation in the Middle East continues to impact energy price transmission, becoming a significant backdrop to recent inflationary pressures. The Federal Reserve's policy path is highly dependent on inflation trends, and market expectations for monetary policy adjustments this year have gradually become more cautious.
Prior to the CPI release, institutional investors generally expected a moderate rebound in April's data, primarily driven by the energy component. Previews from prominent financial institutions and analysts largely pointed to an annualized rate of around 3.7%, emphasizing energy prices as the main driver while also noting potential adjustments in housing-related sub-items. Retail investor discussions were more diverse, with some expressing concern about the risk of the data exceeding expectations. However, the overall atmosphere remained largely one of observation, with no extreme consensus yet formed.
Deep interconnect analysis
The CPI data this time was higher than the market consensus, mainly reflected in the annual rate. Looking at the sub-categories, energy prices rose 3.8% month-on-month, with gasoline prices rising 5.4%, which was the main contributor to overall inflation; food prices rose 0.5% month-on-month, and housing prices rose 0.7% month-on-month. These changes directly correspond to recent dynamics in the energy market.
Historically, the 3.8% annualized rate is back to the mid-2023 range, a stark contrast to previous lows. Latest quotes show core inflation also slightly exceeding expectations, indicating broad-based price pressures. The market's immediate reaction after the announcement was relatively restrained: gold, as a traditional safe-haven asset, fell slightly, reflecting a marginal adjustment in real interest rate expectations; the recovery in interest rate futures suggests that traders' repricing of the Fed's subsequent path has not seen a dramatic shift.
A clear contrast emerged in institutional perspectives before and after the data release. Prior to the release, most institutional analyses focused on the temporary nature of energy-driven inflation, anticipating that core inflation would remain under control. After the data release, some institutions quickly pointed out that while the overall figure exceeded expectations, the deviations in key sub-items were limited, and the real income data showed a month-on-month improvement (-0.2%), indicating some buffer on the household side. Institutional accounts tended to emphasize the interpretation of "primarily energy-driven inflation," avoiding overemphasizing the signal of policy tightening.
Retail investor opinions showed greater volatility. Before the data release, discussions among retail investors ranged from optimism about the "peak of inflation" to concerns about the sustainability of energy prices. After the data release, some retail investors quickly shifted their focus to the possibility of an increased probability of a Fed rate hike, while others believed that the core indicator remained around 2.8%, not yet outside its previous trading range. This discrepancy in expectations reflects a difference in information interpretation: institutions focus more on the breakdown of data structure, while retail investors are more sensitive to the overall figures.
From a technical perspective, related instruments mainly maintained their original trading range before and after the data release, without any trend breakout. Short-term bullish and bearish forces indicate that energy-related factors are providing support for some assets, while interest rate-sensitive instruments are facing some pressure. Overall, the market remains in a dynamic equilibrium driven by data.
Trend Outlook
Based on current data, the sticky nature of the inflation path may persist for some time, with energy factors remaining a key variable. The market will subsequently focus on the Federal Reserve's statements regarding the data and the verification of other economic indicators. Logically, asset prices may continue to fluctuate around data interpretations in the short term, while the medium-term outlook depends on whether a clear inflection point in the inflation trend emerges.
From an interconnected perspective, the correlation between the US dollar index, bond yields, and commodity prices will continue to play a role. If subsequent data continues to validate current levels, interest rate expectations may remain relatively stable; conversely, if energy prices show marginal easing, market pricing in policy flexibility may gradually recover. Overall, the market will continue to be data-sensitive, and volatility may remain relatively high during key event windows.
Frequently Asked Questions
Q: What are the main driving factors behind the better-than-expected CPI data?
A: The main contributor was the energy component, particularly the significant month-on-month increase in gasoline prices, which is directly related to the energy market dynamics under the Middle East situation. While core CPI also slightly exceeded expectations, the deviation was smaller than the overall figure, and sub-categories such as housing showed a stable trend.
Q: Why did gold prices fall slightly after the data was released?
A: As a non-yielding asset, gold is quite sensitive to expectations of real interest rates. Higher-than-expected inflation data led to a slight adjustment in market pricing of monetary policy path, resulting in a short-term decline in safe-haven buying. However, the overall decline was limited, indicating that there was no panic selling in the market.
Q: Where do the differences in opinions between institutional and retail investors lie before and after the data is released?
A: Institutional investors focus more on data structure analysis and tend to attribute better-than-expected results to temporary energy factors; retail investors, on the other hand, react more directly to the overall figures, with some amplifying the risk of policy tightening. Institutional interpretations remained relatively stable before and after the data release, while retail investor sentiment fluctuated more significantly.
Q: What impact will this data have on the Federal Reserve's policy expectations?
A: Market expectations for policy adjustments this year have become more cautious, but the recovery in short-term interest rate futures indicates that traders have not immediately shifted to pricing in extreme tightening. Further observation of other economic indicators is needed.
Q: What variables should we pay close attention to in the future market trend?
A: We need to continuously monitor energy price trends, subsequent inflation data, and policy communications from major economies. The market will revolve around marginal changes in these variables, and volatility is expected to continue to dominate short-term price movements.
- Risk Warning and Disclaimer
- The market involves risk, and trading may not be suitable for all investors. This article is for reference only and does not constitute personal investment advice, nor does it take into account certain users’ specific investment objectives, financial situation, or other needs. Any investment decisions made based on this information are at your own risk.