US April CPI and inflation exceed expectations, highlighting the inflation dilemma under a K-shaped economic pattern.
2026-05-12 20:46:13
The latest data released by the U.S. Bureau of Labor Statistics shows that the CPI rose 3.7% year-on-year in April, while the core CPI rose 2.7% year-on-year.
Although in absolute terms, the two figures are only slightly higher than the market consensus by 0.1 percentage points, this "0.1" disturbance sends extremely complex macroeconomic signals during the current critical window of the Fed's policy shift.

The core logic behind the better-than-expected data lies in the pervasive inflationary pressures across the entire industry chain.
Direct impact of energy: Affected by the geopolitical conflict in Iran and the reduction of international crude oil production, the 6% month-on-month increase in gasoline prices became the "main engine" for the overall CPI increase.
The technical rebound in housing costs: The data carryover effect caused by the government shutdown last October was concentrated in April.
Since rent and landlord equivalent rent (OER) account for about one-third of the CPI weighting, the technical strengthening of this component actually provides a solid "base" for core inflation.
Based on recent non-farm payroll data, the unexpected inflation reveals a profound structural contradiction in the labor force:
The wage-price spiral in low-end industries: Employment growth is mainly concentrated in basic service industries such as retail and catering. These industries are labor-intensive, and in order to cope with the difficulty of recruiting, hourly wages have been forced to rise, which directly leads to the strong resilience of core service inflation (services excluding energy).
The cost of losing older workers: The reduction in senior employees over 50 years old has resulted in a "permanent contraction" in the labor supply.
This means that businesses must pay higher premiums to fill the productivity gap, and this cost-push pressure is something that monetary policy can hardly resolve in the short term.
The unexpected 0.1 is not just a number; it reflects the increasingly severe "K-shaped" wealth inequality in American society.
The asset-side boom: The stock market rally supported the purchasing power of high-net-worth individuals through the wealth effect. This group is not sensitive to high interest rates, which has maintained the inflation center of high-end service industries (such as airfares and medical care).
The drain on consumer spending: For low- and middle-income groups, the unexpected surge in housing and energy prices—two "essential" needs—is severely squeezing their discretionary spending power. The higher-than-expected CPI means a substantial deterioration in the cost of living for the most vulnerable.
The core point of contention in the market right now is whether energy prices have already begun to experience "secondary transmission."
Data shows that the core CPI rose 0.3% month-on-month in April, slightly higher than in March. This indicates that energy costs have begun to penetrate the previously relatively weak goods and services sector through channels such as transportation and logistics.
If this spillover effect continues, inflation will shift from being “imported” to “endogenous”.
Even if the data both exceed expectations, the Federal Reserve will most likely keep the benchmark interest rate unchanged in the short term.
Challenges: Lowering interest rates would further stimulate the stock market and consumption by high-net-worth individuals, exacerbating inflationary pressures; not lowering interest rates could lead to a debt crisis for low-end industries and heavily indebted low- and middle-income earners.
Judgment: The Federal Reserve needs more time to observe whether the housing cost adjustment is a "one-off shock" and whether high oil prices will trigger broader wage increases.
The slight overshoot of April's CPI signals the difficulty of the final step towards inflation in the United States.
This is no longer just a simple monetary issue, but the result of the combined effects of energy supply shocks, structural labor shortages, and K-type wealth inequality.
With housing costs and energy pressures looming large, inflation will be more persistent than the market anticipates.
The US dollar index maintained a strong rebound before the data release. This was partly due to the fact that pricing in the Fed makes it difficult to shift to a dovish stance in this situation, and it can only maintain a hawkish stance or keep interest rates unchanged. At the same time, the escalating geopolitical risks are another reason for the dollar's strength. Of course, the recent weakening of the British pound has also boosted the dollar.
From a technical perspective, the US dollar index has rebounded to the middle of its trading range, and the moving averages are still generally in a bearish alignment. The normal trend is for the US dollar index to fluctuate or even slightly decline near this resistance level. If it breaks out strongly and continues to rise, it would be an unexpected move, and traders would need to find more market information to explain this phenomenon or participate in trading.
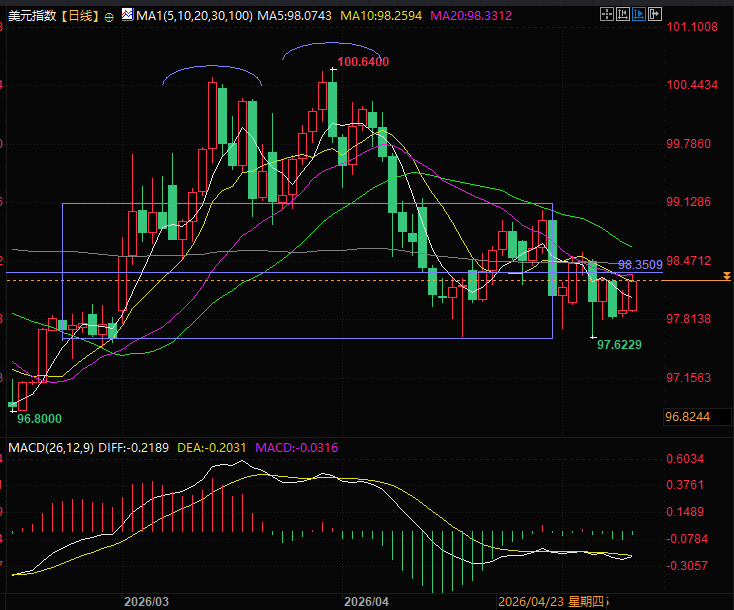
(US Dollar Index Daily Chart, Source: EasyForex)
At 20:44 Beijing time, the US dollar index is currently at 98.27.
Although in absolute terms, the two figures are only slightly higher than the market consensus by 0.1 percentage points, this "0.1" disturbance sends extremely complex macroeconomic signals during the current critical window of the Fed's policy shift.
The Relay of Inflation Drivers: From Energy to Housing
The core logic behind the better-than-expected data lies in the pervasive inflationary pressures across the entire industry chain.
Direct impact of energy: Affected by the geopolitical conflict in Iran and the reduction of international crude oil production, the 6% month-on-month increase in gasoline prices became the "main engine" for the overall CPI increase.
The technical rebound in housing costs: The data carryover effect caused by the government shutdown last October was concentrated in April.
Since rent and landlord equivalent rent (OER) account for about one-third of the CPI weighting, the technical strengthening of this component actually provides a solid "base" for core inflation.
The "Mismatch Effect" in the Labor Market: Fueled by Low-End Industries
Based on recent non-farm payroll data, the unexpected inflation reveals a profound structural contradiction in the labor force:
The wage-price spiral in low-end industries: Employment growth is mainly concentrated in basic service industries such as retail and catering. These industries are labor-intensive, and in order to cope with the difficulty of recruiting, hourly wages have been forced to rise, which directly leads to the strong resilience of core service inflation (services excluding energy).
The cost of losing older workers: The reduction in senior employees over 50 years old has resulted in a "permanent contraction" in the labor supply.
This means that businesses must pay higher premiums to fill the productivity gap, and this cost-push pressure is something that monetary policy can hardly resolve in the short term.
K-shaped economic pattern intensifies: the divergence between the wealth effect and perceived inflation.
The unexpected 0.1 is not just a number; it reflects the increasingly severe "K-shaped" wealth inequality in American society.
The asset-side boom: The stock market rally supported the purchasing power of high-net-worth individuals through the wealth effect. This group is not sensitive to high interest rates, which has maintained the inflation center of high-end service industries (such as airfares and medical care).
The drain on consumer spending: For low- and middle-income groups, the unexpected surge in housing and energy prices—two "essential" needs—is severely squeezing their discretionary spending power. The higher-than-expected CPI means a substantial deterioration in the cost of living for the most vulnerable.
Key concern: Has secondary transmission begun?
The core point of contention in the market right now is whether energy prices have already begun to experience "secondary transmission."
Data shows that the core CPI rose 0.3% month-on-month in April, slightly higher than in March. This indicates that energy costs have begun to penetrate the previously relatively weak goods and services sector through channels such as transportation and logistics.
If this spillover effect continues, inflation will shift from being “imported” to “endogenous”.
The Federal Reserve's stance: Entering "observational sentinel" mode.
Even if the data both exceed expectations, the Federal Reserve will most likely keep the benchmark interest rate unchanged in the short term.
Challenges: Lowering interest rates would further stimulate the stock market and consumption by high-net-worth individuals, exacerbating inflationary pressures; not lowering interest rates could lead to a debt crisis for low-end industries and heavily indebted low- and middle-income earners.
Judgment: The Federal Reserve needs more time to observe whether the housing cost adjustment is a "one-off shock" and whether high oil prices will trigger broader wage increases.
Summary and Technical Analysis:
The slight overshoot of April's CPI signals the difficulty of the final step towards inflation in the United States.
This is no longer just a simple monetary issue, but the result of the combined effects of energy supply shocks, structural labor shortages, and K-type wealth inequality.
With housing costs and energy pressures looming large, inflation will be more persistent than the market anticipates.
The US dollar index maintained a strong rebound before the data release. This was partly due to the fact that pricing in the Fed makes it difficult to shift to a dovish stance in this situation, and it can only maintain a hawkish stance or keep interest rates unchanged. At the same time, the escalating geopolitical risks are another reason for the dollar's strength. Of course, the recent weakening of the British pound has also boosted the dollar.
From a technical perspective, the US dollar index has rebounded to the middle of its trading range, and the moving averages are still generally in a bearish alignment. The normal trend is for the US dollar index to fluctuate or even slightly decline near this resistance level. If it breaks out strongly and continues to rise, it would be an unexpected move, and traders would need to find more market information to explain this phenomenon or participate in trading.
(US Dollar Index Daily Chart, Source: EasyForex)
At 20:44 Beijing time, the US dollar index is currently at 98.27.
- Risk Warning and Disclaimer
- The market involves risk, and trading may not be suitable for all investors. This article is for reference only and does not constitute personal investment advice, nor does it take into account certain users’ specific investment objectives, financial situation, or other needs. Any investment decisions made based on this information are at your own risk.