Crude oil bulls and bears battled at the $100 mark, while the bond market quietly dealt a blow to global assets.
2026-05-18 20:00:04
On Monday (May 18), global financial markets showed a clear divergence. The US dollar index remained strong, and the 10-year US Treasury yield continued to hit new highs, leading to significant selling pressure in global bond markets. Affected by the situation in the Middle East, crude oil prices reached a two-week high, while gold, although slightly recovering from a low of over a month and a half, was pressured by the high-yield environment. Data shows that the simultaneous strengthening of the US dollar and US Treasury yields significantly constrained non-yielding assets, while crude oil moved relatively independently due to geopolitical factors, exhibiting a pronounced high-level consolidation pattern.
Global bond markets were the focus today, with the yield on the benchmark German 10-year government bond hitting a 15-year high, and the yield on the US 10-year Treasury bond also rising to its highest level since February 2025. Japanese government bond yields rose in tandem, reflecting investors' synchronized adjustments in their expectations regarding inflation risks and interest rates.
Global bond markets continued their correction today, with Eurozone bond yields rising significantly. The yield on German 10-year government bonds hit a 15-year high, rising 2.5 basis points to 3.1796% from the previous trading day. The Italian 10-year yield also rose to approximately 3.973%. This trend mirrors that of the US and Japanese bond markets, with the US 10-year Treasury yield breaking through its upper limit to a new cycle high, currently at 4.598%, indicating strong bullish momentum.
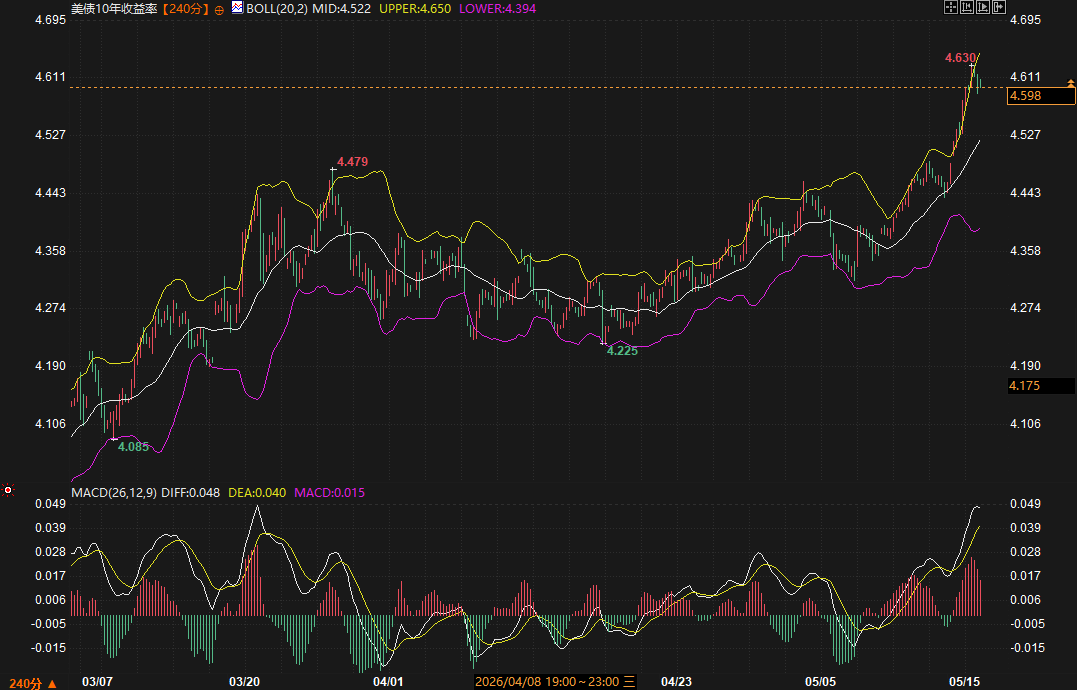
From a technical perspective, the Bollinger Bands for the 10-year US Treasury yield are at 4.650 (upper band), 4.394 (lower band), and 4.522 (middle band). The price has broken through the upper band and continues to reach new highs. The MACD indicator shows that the DIFF and DEA lines are rising above the zero line, with the red bars expanding, indicating a clear upward trend and sufficient momentum. Since the low of 4.225 in late April, the yield has shown an accelerated upward trend. On the fundamental front, the situation in the Middle East has led to higher energy prices, pushing up inflation expectations and exacerbating market concerns about the path of global central bank interest rates, becoming the main driving factor for the bond market correction. In the short term, the 4.60%-4.63% range constitutes initial resistance; a successful break above this level could lead to further testing of higher levels.
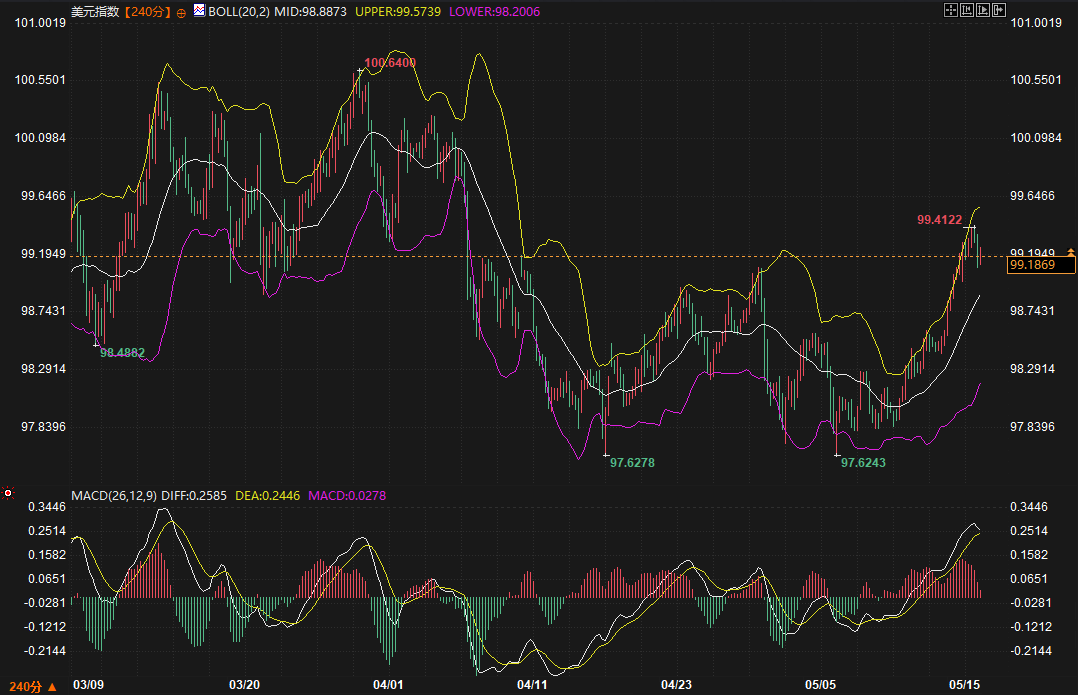
The US dollar index is currently trading at 99.1869, above the Bollinger Band middle line at 98.8873 and close to the upper line at 99.5739, moving along a strong channel. The MACD indicator shows that the two lines continue their upward trend above the zero axis, and although the red bars have narrowed somewhat, they are still positive, indicating that the bullish trend continues. The candlestick pattern shows a one-sided upward movement since the low point in early May, breaking through multiple resistance levels.
This strength, coupled with rising US Treasury yields, directly suppresses assets such as gold. The logic suggests that increased attractiveness of dollar assets is driving capital flows to support a simultaneous strengthening of the dollar and yields. In the short term, the upper Bollinger Band around 99.57 presents resistance, while the middle Bollinger Band around 98.89 provides initial support. If the dollar remains above the middle Bollinger Band, the short-term bullish trend is likely to continue.
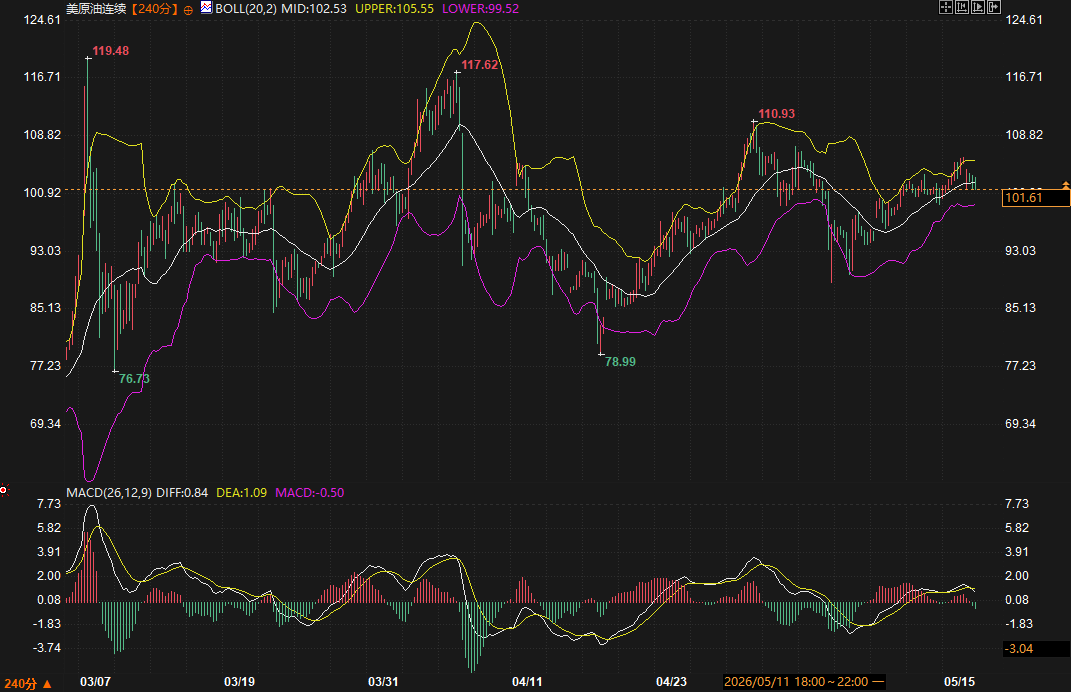
US crude oil futures are currently priced at 101.61, below the Bollinger Band middle line at 102.53, indicating a range-bound movement in the lower half of the range. The MACD indicator shows a death cross near the zero line, with a slight increase in the green bars, suggesting a weakening of short-term bullish momentum. In terms of candlestick patterns, after bottoming out in mid-April, the price rebounded, then fell back after reaching a high in early May. Currently, it exhibits clear characteristics of high-level consolidation, with intensified competition between bulls and bears.
Fundamental drivers are relatively independent. Influenced by the situation in the Middle East, Brent crude oil once rose above $110 per barrel. Latest data shows that geopolitical tensions have increased risks to shipping routes, leading to rapid depletion of commercial crude oil inventories. Technically, the lower Bollinger Band around 99.52 provides significant support, while the middle Bollinger Band around 102.53 represents the core short-term trading range. With supply and demand factors intertwined with macroeconomic sentiment, the short-term direction still needs further confirmation, but the high-level consolidation pattern is expected to continue.
The latest spot gold price is 4541.90, with the Bollinger Band middle line at 4616.61 and the lower line at 4472.55. The price has broken below the middle line and is approaching the lower line support, with the latest low at 4480.52 near the lower line. The MACD indicator shows that the two lines are below the zero axis and continue to decline, with the green bars expanding, indicating strong bearish momentum. After forming a double top pattern, the candlestick chart shows consecutive bearish closes, indicating a clear medium-term downward trend.
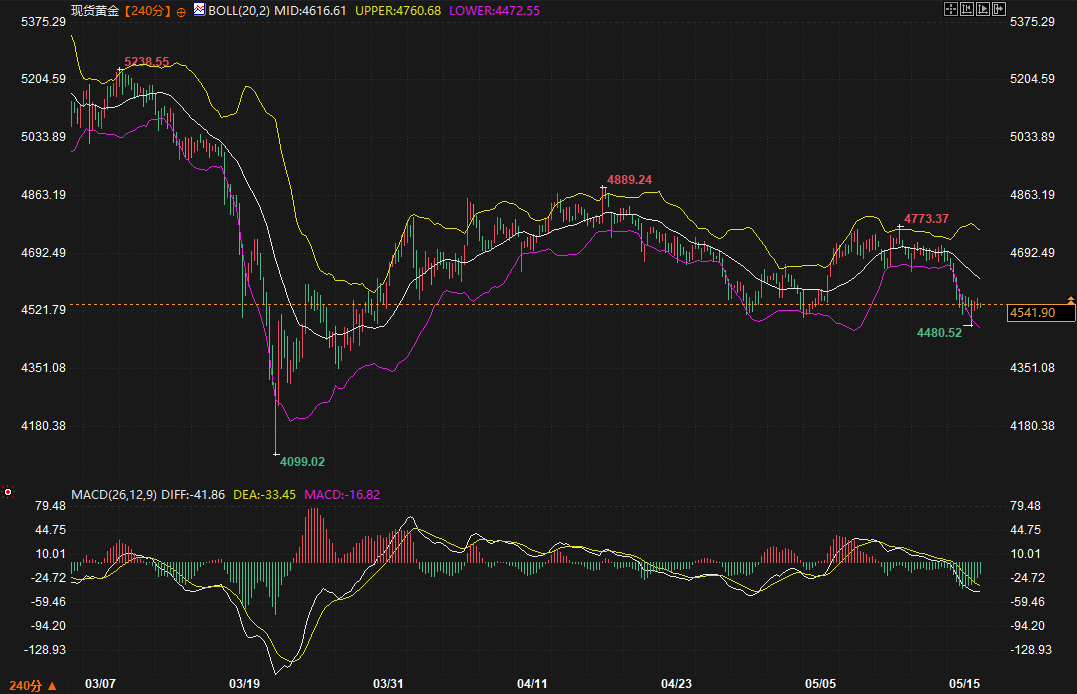
Despite a slight rebound from a more than one-and-a-half-month low today, the high-yield environment and the strong dollar are both constraining the market. Fundamentals indicate that market expectations of "higher and longer" interest rates are weakening the attractiveness of non-yielding assets, while geopolitical factors are providing some safe-haven support. Technically, the lower Bollinger Band around 4472 is a key support level, while the middle Bollinger Band around 4616 is a resistance level for any rebound. The current price is close to the lower Bollinger Band, suggesting a possible short-term technical rebound, but the overall downward pressure remains unchanged.
The pace of adjustment in the global bond market will be a key point of observation in the next 2-3 days. If US Treasury yields fluctuate within the 4.58%-4.63% range, the strength of the US dollar may stabilize in the short term, easing downward pressure on gold, but limiting the upside potential. Crude oil will continue to be dominated by the situation in the Middle East, and attention should be paid to marginal changes in supply and demand during the high-level fluctuations.
Logically, the combined downward pressure on gold from the dollar and yield curve is likely to continue, while crude oil exhibits relatively strong independence. The overall market remains in an environment intertwined with geopolitical and macroeconomic policy expectations, requiring close monitoring of this week's PMI and other data to validate inflation expectations. Short-term price movements are expected to be characterized by a mix of range-bound trading and trend confirmation, with support and resistance levels serving as key references for trading decisions.
How significant is the spillover effect of the global bond market sell-off on other assets?
Today's global bond market correction was primarily driven by the Middle East situation, which has pushed up energy prices and inflation expectations. Rising yields have directly increased the attractiveness of dollar assets, putting downward pressure on non-yielding assets such as gold. Data shows that after US Treasury yields broke through their upper technical level, the correlation effect has been reflected in the divergence between gold and the dollar's price movements. This transmission is expected to continue in the short term, but if yields experience a technical pullback, cross-market pressures may ease temporarily.
How effective is the current lower support level for gold?
Technical data shows that gold prices are approaching the lower Bollinger Band at around 4472.55, near the previous low of 4480.52. Although bearish momentum is strong, the "oversold" technical indicators are evident, coupled with geopolitical risk aversion factors, suggesting a possible short-term rebound. However, with the dollar and yields strengthening in tandem, the lower Bollinger Band support will face repeated tests, while the middle Bollinger Band around 4616 presents strong resistance for any rebound.
What are the conditions for a breakout from the high-level consolidation of crude oil?
Crude oil is currently trading in the lower half of the Bollinger Bands, fluctuating between 101 and 103. Developments in the Middle East situation, changes in geopolitical risk premiums, and inventory data will be key factors for a breakout. If shipping route risks persist, prices are likely to test previous highs; conversely, if tensions ease, prices may retest support near the lower Bollinger Band at 99.52. The current battle between bulls and bears is intensifying, and the short-term direction remains unclear.
Can the US dollar index maintain its current strength?
The US dollar index is near the upper Bollinger Band, with the MACD bullish signal continuing and the price action clearly showing a one-sided upward trend. While speculative long positions in the dollar have contracted somewhat, the overall strong channel remains intact. The middle Bollinger Band at 98.89 is a key support level, while the upper Bollinger Band at 99.57 represents resistance. If US Treasury yields remain high over the next 2-3 days, the dollar's bullish trend is likely to continue.
What is the potential impact of this week's key data on market trends?
This week's focus will be on Eurozone and UK PMI data, consumer confidence, and the German Ifo survey. These data will examine whether inflation is transmitting to the real economy, thus influencing central bank interest rate expectations. If export price pressures emerge, bond yields may remain high, continuing to suppress gold prices; conversely, if growth concerns intensify, it may alleviate some selling pressure. Crude oil, on the other hand, is more driven by geopolitical events, with macroeconomic data serving as supplementary confirmation.
Global bond markets were the focus today, with the yield on the benchmark German 10-year government bond hitting a 15-year high, and the yield on the US 10-year Treasury bond also rising to its highest level since February 2025. Japanese government bond yields rose in tandem, reflecting investors' synchronized adjustments in their expectations regarding inflation risks and interest rates.
Global bond market sell-off and upward pressure on yields
Global bond markets continued their correction today, with Eurozone bond yields rising significantly. The yield on German 10-year government bonds hit a 15-year high, rising 2.5 basis points to 3.1796% from the previous trading day. The Italian 10-year yield also rose to approximately 3.973%. This trend mirrors that of the US and Japanese bond markets, with the US 10-year Treasury yield breaking through its upper limit to a new cycle high, currently at 4.598%, indicating strong bullish momentum.
From a technical perspective, the Bollinger Bands for the 10-year US Treasury yield are at 4.650 (upper band), 4.394 (lower band), and 4.522 (middle band). The price has broken through the upper band and continues to reach new highs. The MACD indicator shows that the DIFF and DEA lines are rising above the zero line, with the red bars expanding, indicating a clear upward trend and sufficient momentum. Since the low of 4.225 in late April, the yield has shown an accelerated upward trend. On the fundamental front, the situation in the Middle East has led to higher energy prices, pushing up inflation expectations and exacerbating market concerns about the path of global central bank interest rates, becoming the main driving factor for the bond market correction. In the short term, the 4.60%-4.63% range constitutes initial resistance; a successful break above this level could lead to further testing of higher levels.
The strong performance of the US dollar index and its related effects
The US dollar index is currently trading at 99.1869, above the Bollinger Band middle line at 98.8873 and close to the upper line at 99.5739, moving along a strong channel. The MACD indicator shows that the two lines continue their upward trend above the zero axis, and although the red bars have narrowed somewhat, they are still positive, indicating that the bullish trend continues. The candlestick pattern shows a one-sided upward movement since the low point in early May, breaking through multiple resistance levels.
This strength, coupled with rising US Treasury yields, directly suppresses assets such as gold. The logic suggests that increased attractiveness of dollar assets is driving capital flows to support a simultaneous strengthening of the dollar and yields. In the short term, the upper Bollinger Band around 99.57 presents resistance, while the middle Bollinger Band around 98.89 provides initial support. If the dollar remains above the middle Bollinger Band, the short-term bullish trend is likely to continue.
Crude oil prices fluctuate at high levels amid geopolitical supply and demand dynamics.
US crude oil futures are currently priced at 101.61, below the Bollinger Band middle line at 102.53, indicating a range-bound movement in the lower half of the range. The MACD indicator shows a death cross near the zero line, with a slight increase in the green bars, suggesting a weakening of short-term bullish momentum. In terms of candlestick patterns, after bottoming out in mid-April, the price rebounded, then fell back after reaching a high in early May. Currently, it exhibits clear characteristics of high-level consolidation, with intensified competition between bulls and bears.
Fundamental drivers are relatively independent. Influenced by the situation in the Middle East, Brent crude oil once rose above $110 per barrel. Latest data shows that geopolitical tensions have increased risks to shipping routes, leading to rapid depletion of commercial crude oil inventories. Technically, the lower Bollinger Band around 99.52 provides significant support, while the middle Bollinger Band around 102.53 represents the core short-term trading range. With supply and demand factors intertwined with macroeconomic sentiment, the short-term direction still needs further confirmation, but the high-level consolidation pattern is expected to continue.
Gold Under Pressure and Testing Technical Support
The latest spot gold price is 4541.90, with the Bollinger Band middle line at 4616.61 and the lower line at 4472.55. The price has broken below the middle line and is approaching the lower line support, with the latest low at 4480.52 near the lower line. The MACD indicator shows that the two lines are below the zero axis and continue to decline, with the green bars expanding, indicating strong bearish momentum. After forming a double top pattern, the candlestick chart shows consecutive bearish closes, indicating a clear medium-term downward trend.
Despite a slight rebound from a more than one-and-a-half-month low today, the high-yield environment and the strong dollar are both constraining the market. Fundamentals indicate that market expectations of "higher and longer" interest rates are weakening the attractiveness of non-yielding assets, while geopolitical factors are providing some safe-haven support. Technically, the lower Bollinger Band around 4472 is a key support level, while the middle Bollinger Band around 4616 is a resistance level for any rebound. The current price is close to the lower Bollinger Band, suggesting a possible short-term technical rebound, but the overall downward pressure remains unchanged.
Trend Outlook
The pace of adjustment in the global bond market will be a key point of observation in the next 2-3 days. If US Treasury yields fluctuate within the 4.58%-4.63% range, the strength of the US dollar may stabilize in the short term, easing downward pressure on gold, but limiting the upside potential. Crude oil will continue to be dominated by the situation in the Middle East, and attention should be paid to marginal changes in supply and demand during the high-level fluctuations.
Logically, the combined downward pressure on gold from the dollar and yield curve is likely to continue, while crude oil exhibits relatively strong independence. The overall market remains in an environment intertwined with geopolitical and macroeconomic policy expectations, requiring close monitoring of this week's PMI and other data to validate inflation expectations. Short-term price movements are expected to be characterized by a mix of range-bound trading and trend confirmation, with support and resistance levels serving as key references for trading decisions.
Frequently Asked Questions
How significant is the spillover effect of the global bond market sell-off on other assets?
Today's global bond market correction was primarily driven by the Middle East situation, which has pushed up energy prices and inflation expectations. Rising yields have directly increased the attractiveness of dollar assets, putting downward pressure on non-yielding assets such as gold. Data shows that after US Treasury yields broke through their upper technical level, the correlation effect has been reflected in the divergence between gold and the dollar's price movements. This transmission is expected to continue in the short term, but if yields experience a technical pullback, cross-market pressures may ease temporarily.
How effective is the current lower support level for gold?
Technical data shows that gold prices are approaching the lower Bollinger Band at around 4472.55, near the previous low of 4480.52. Although bearish momentum is strong, the "oversold" technical indicators are evident, coupled with geopolitical risk aversion factors, suggesting a possible short-term rebound. However, with the dollar and yields strengthening in tandem, the lower Bollinger Band support will face repeated tests, while the middle Bollinger Band around 4616 presents strong resistance for any rebound.
What are the conditions for a breakout from the high-level consolidation of crude oil?
Crude oil is currently trading in the lower half of the Bollinger Bands, fluctuating between 101 and 103. Developments in the Middle East situation, changes in geopolitical risk premiums, and inventory data will be key factors for a breakout. If shipping route risks persist, prices are likely to test previous highs; conversely, if tensions ease, prices may retest support near the lower Bollinger Band at 99.52. The current battle between bulls and bears is intensifying, and the short-term direction remains unclear.
Can the US dollar index maintain its current strength?
The US dollar index is near the upper Bollinger Band, with the MACD bullish signal continuing and the price action clearly showing a one-sided upward trend. While speculative long positions in the dollar have contracted somewhat, the overall strong channel remains intact. The middle Bollinger Band at 98.89 is a key support level, while the upper Bollinger Band at 99.57 represents resistance. If US Treasury yields remain high over the next 2-3 days, the dollar's bullish trend is likely to continue.
What is the potential impact of this week's key data on market trends?
This week's focus will be on Eurozone and UK PMI data, consumer confidence, and the German Ifo survey. These data will examine whether inflation is transmitting to the real economy, thus influencing central bank interest rate expectations. If export price pressures emerge, bond yields may remain high, continuing to suppress gold prices; conversely, if growth concerns intensify, it may alleviate some selling pressure. Crude oil, on the other hand, is more driven by geopolitical events, with macroeconomic data serving as supplementary confirmation.
- Risk Warning and Disclaimer
- The market involves risk, and trading may not be suitable for all investors. This article is for reference only and does not constitute personal investment advice, nor does it take into account certain users’ specific investment objectives, financial situation, or other needs. Any investment decisions made based on this information are at your own risk.