Gold Analysis: Rising US Treasury yields increase downside risk for gold prices
2026-05-19 19:14:12
On Tuesday (May 19th) during the European session, spot gold continued to be under pressure in the early morning, with bulls lacking a strong opportunity to counterattack. The market has shown a weak pattern of lower highs and lower lows for five consecutive trading days. On Monday, gold prices touched a low of $4480.52 per ounce, briefly breaking below the classic technical level of $4481.78, a key level for distinguishing bull and bear trends, before quickly rebounding to around $4538.82. This price level is a key point closely monitored by quantitative trading algorithms; even with a slight rebound at this level, it does not mean that the downward pressure has been completely relieved.

Unusual oil price movements signal the start of a downward trend.
The root cause of this round of abnormal commodity price movements lies in the crude oil market. Currently, Brent crude oil prices are approaching $110, while West Texas Intermediate (WTI) crude oil prices for June delivery remain in the $100-$105 range. The persistently high oil prices continue to fuel market anxiety about inflation.
The current situation regarding shipping disruptions in the Strait of Hormuz remains unresolved, and the geopolitical stalemate has directly led to persistently high global energy prices. Rising oil prices have driven up refined oil prices, which in turn have increased global logistics and transportation costs, ultimately resulting in higher prices for all categories of goods. This transmission logic is directly reflected in the April inflation data, which exceeded market expectations, with a year-on-year increase of 3.8% or higher.
After three consecutive periods of inflation data exceeded expectations, the bond market was the first to react, and market funds began to reassess the trend of macro interest rates.
Soaring US Treasury yields severely impact gold prices
On Monday, the yield on the 10-year U.S. Treasury note climbed to 4.631%, a new high since February 12, 2025; the yield on the 30-year U.S. Treasury note rose in tandem, reaching 5.159%, a new peak since October 2023.
The recent sharp fluctuations in the bond market indicate that the global market is repricing the future direction of the Federal Reserve's interest rates in real time. Gold is a non-interest-bearing asset, meaning it does not generate any interest income during its holding period. Meanwhile, the continuous rise in US Treasury yields has led conservative funds to withdraw from the gold market and flow into the bond market to seek stable returns. This is the core reason for the continued weakness in spot gold over the past five trading days.
While gold retains its traditional safe-haven appeal amid geopolitical turmoil, the negative impact of interest rate trends in the current market environment has completely overshadowed safe-haven buying support for gold. Escalating geopolitical conflicts pushing up oil prices, oil prices fueling inflation, the Federal Reserve maintaining interest rates, and persistently high US Treasury yields—a series of interconnected negative factors—have continuously suppressed gold prices.
A stronger dollar has further increased downward pressure on gold prices.
The US dollar index has rebounded strongly from its recent multi-month low of 97.625, gradually approaching the important psychological level of 100. Global gold transactions are all denominated in US dollars. With the continued appreciation of the dollar, the cost of purchasing gold for overseas investors using non-US currencies such as the euro and yen has increased significantly, directly weakening international gold consumption and investment demand. This, coupled with the negative impact of US Treasury bonds, further exacerbates the selling pressure on gold, creating a double-whammy situation.
Federal Reserve policy becomes a core variable in market trends.
At the beginning of this year, the market generally predicted that the Federal Reserve would start a rate-cutting cycle. This expectation was also the core support for the previous surge in gold prices, which reached a high of $5,419.01 in March.
However, persistently high inflation data completely reversed market expectations, with the Federal Reserve maintaining its benchmark interest rate unchanged. The continuously exceeding inflation expectations further delayed market expectations of interest rate cuts. Currently, the market is betting on a greater than 40% probability of a Fed rate hike in January, compared to almost zero a month ago.
The market logic has reversed: the implementation of the interest rate cut cycle will reduce the attractiveness of cash and fixed-income products, which is good for gold, a non-interest-bearing asset; conversely, the long-term continuation of high interest rates will continue to divert funds from the gold market, and the Fed policy expectations that were good for gold at the beginning of the year have now completely turned into a negative factor.
There is still buying interest at lower market levels.
Despite the continued decline in gold prices, they have not completely lost the support of bargain hunters. After gold prices briefly fell below the $4,481.78 mark on Monday, bargain hunters quickly entered the market to support the price, which rebounded rapidly to the current $4,538.82, proving that market funds are still defending this key support level.
Looking back at the market performance this year, a large influx of buyers entered the market when gold prices fell to $4099.02 on March 23. It then rebounded all the way to a high of $4889.24 on April 17 before encountering resistance and falling back. In May, it faced a second strong resistance level near $4773.37 and fell back again. This shows that demand in the gold market has not completely subsided; the current market movement is merely a revaluation in a high-interest-rate environment, not a complete exodus of funds.
Spot Gold Technical Analysis
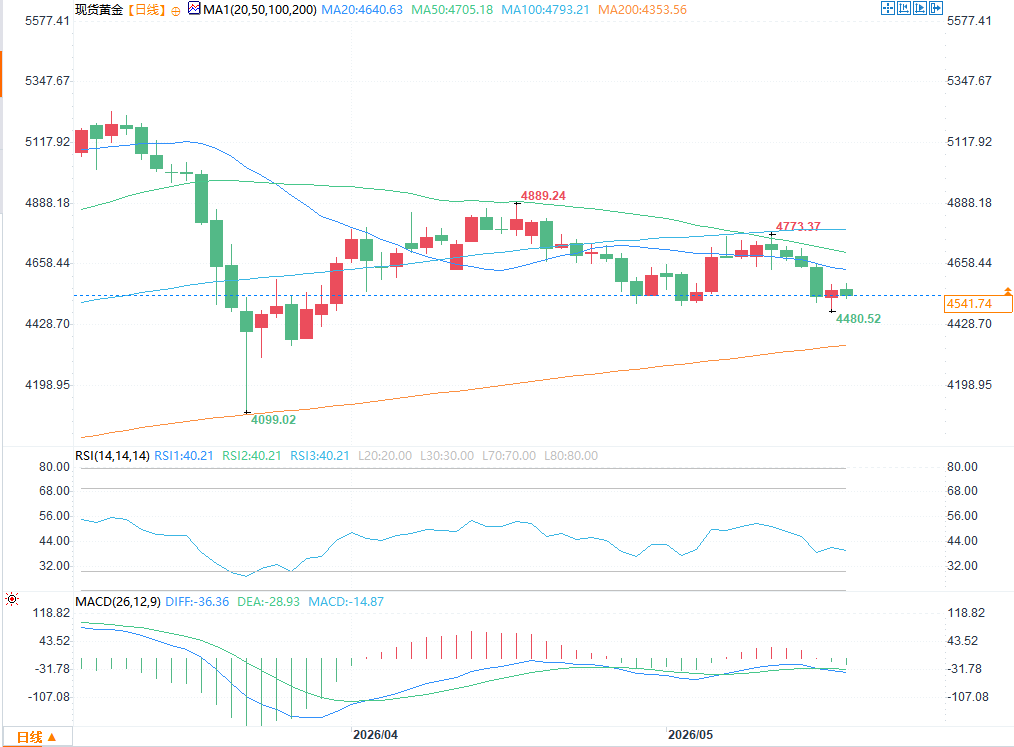
(Spot gold daily chart source: FX678)
Gold prices officially broke below the previous low of $4,501.04 on Monday, confirming a short-term downtrend. The $4,481.78 level is within the core range of the short-term correction from $4,401.84 to $4,495.33, and is also a key support level for the year.
From the perspective of moving average indicators, the market trends are clearly divergent:
Investors who use the 200-day moving average at $4353.55 as the core support for the long-term trend believe that the current gold price has entered a low-level entry range with small stop-loss margins and a relatively high cost-effectiveness.
Investors who use the 50-day moving average at $4705.12 as short-term trend resistance tend to short the market, predicting that gold prices are likely to fall below the 200-day moving average.
The short-term 50-day moving average continues its downward trend, gradually converging towards the slowly rising 200-day moving average. A bearish death cross is imminent, indicating an increasing risk of a medium- to long-term downtrend for gold. Currently, the 20-day moving average is at $4640.49, and the 100-day moving average is at $4793.18. The overall moving average system is bearish, with significant resistance above.
From a technical perspective, the $4481.78 level represents a 20% drop from the historical high of $5602.23, making it a widely recognized dividing line between bull and bear markets for gold. The key focus going forward is whether quantitative trading funds can sustain significant support at this price level to maintain the bull market trend. If this level is breached, the market will fully transition into a bear market.
From an indicator perspective, the current RSI is 40.03, which is in the neutral to bearish range and has not yet entered the oversold zone, indicating that there is still room for further decline in the short term. In the MACD indicator, the DIFF line is -36.60, the DEA line is -28.98, and the MACD histogram is -15.25. Although the green bars show signs of narrowing, the overall trend is still in a bearish divergence correction phase, and the rebound momentum is limited.
The support level held temporarily on Monday, leading to a rebound, but whether it can hold firm when tested multiple times remains the biggest question mark in the gold market this week.
Key areas to watch in the future
Crude oil price movements and Federal Reserve interest rate expectations remain the two core factors driving gold price movements, and both factors are currently bearish for gold.
If geopolitical tensions in the Middle East ease and international oil prices fall sharply, market inflation anxiety will cool down, the 10-year US Treasury yield is expected to fall below 4.5%, and the US dollar index will weaken accordingly. Only then will gold prices have a chance to stabilize and rebound, and challenge the $4,700 level and above.
If the geopolitical situation remains deadlocked, oil prices remain high, and high interest rate expectations persist, gold prices will continue to be under pressure.
From a technical perspective, closely monitor the bearish crossover of the 50-day and 200-day moving averages. The most crucial level remains the $4481.78 mark, a key dividing line between bullish and bearish trends. Whether this price level holds this week will directly determine the medium- to long-term direction of gold. Short-term resistance levels to watch are $4640.49 (20-day moving average) and $4705.12 (50-day moving average). Key support is at $4481.78; a break below this level would target $4353.55 (200-day moving average).
Unusual oil price movements signal the start of a downward trend.
The root cause of this round of abnormal commodity price movements lies in the crude oil market. Currently, Brent crude oil prices are approaching $110, while West Texas Intermediate (WTI) crude oil prices for June delivery remain in the $100-$105 range. The persistently high oil prices continue to fuel market anxiety about inflation.
The current situation regarding shipping disruptions in the Strait of Hormuz remains unresolved, and the geopolitical stalemate has directly led to persistently high global energy prices. Rising oil prices have driven up refined oil prices, which in turn have increased global logistics and transportation costs, ultimately resulting in higher prices for all categories of goods. This transmission logic is directly reflected in the April inflation data, which exceeded market expectations, with a year-on-year increase of 3.8% or higher.
After three consecutive periods of inflation data exceeded expectations, the bond market was the first to react, and market funds began to reassess the trend of macro interest rates.
Soaring US Treasury yields severely impact gold prices
On Monday, the yield on the 10-year U.S. Treasury note climbed to 4.631%, a new high since February 12, 2025; the yield on the 30-year U.S. Treasury note rose in tandem, reaching 5.159%, a new peak since October 2023.
The recent sharp fluctuations in the bond market indicate that the global market is repricing the future direction of the Federal Reserve's interest rates in real time. Gold is a non-interest-bearing asset, meaning it does not generate any interest income during its holding period. Meanwhile, the continuous rise in US Treasury yields has led conservative funds to withdraw from the gold market and flow into the bond market to seek stable returns. This is the core reason for the continued weakness in spot gold over the past five trading days.
While gold retains its traditional safe-haven appeal amid geopolitical turmoil, the negative impact of interest rate trends in the current market environment has completely overshadowed safe-haven buying support for gold. Escalating geopolitical conflicts pushing up oil prices, oil prices fueling inflation, the Federal Reserve maintaining interest rates, and persistently high US Treasury yields—a series of interconnected negative factors—have continuously suppressed gold prices.
A stronger dollar has further increased downward pressure on gold prices.
The US dollar index has rebounded strongly from its recent multi-month low of 97.625, gradually approaching the important psychological level of 100. Global gold transactions are all denominated in US dollars. With the continued appreciation of the dollar, the cost of purchasing gold for overseas investors using non-US currencies such as the euro and yen has increased significantly, directly weakening international gold consumption and investment demand. This, coupled with the negative impact of US Treasury bonds, further exacerbates the selling pressure on gold, creating a double-whammy situation.
Federal Reserve policy becomes a core variable in market trends.
At the beginning of this year, the market generally predicted that the Federal Reserve would start a rate-cutting cycle. This expectation was also the core support for the previous surge in gold prices, which reached a high of $5,419.01 in March.
However, persistently high inflation data completely reversed market expectations, with the Federal Reserve maintaining its benchmark interest rate unchanged. The continuously exceeding inflation expectations further delayed market expectations of interest rate cuts. Currently, the market is betting on a greater than 40% probability of a Fed rate hike in January, compared to almost zero a month ago.
The market logic has reversed: the implementation of the interest rate cut cycle will reduce the attractiveness of cash and fixed-income products, which is good for gold, a non-interest-bearing asset; conversely, the long-term continuation of high interest rates will continue to divert funds from the gold market, and the Fed policy expectations that were good for gold at the beginning of the year have now completely turned into a negative factor.
There is still buying interest at lower market levels.
Despite the continued decline in gold prices, they have not completely lost the support of bargain hunters. After gold prices briefly fell below the $4,481.78 mark on Monday, bargain hunters quickly entered the market to support the price, which rebounded rapidly to the current $4,538.82, proving that market funds are still defending this key support level.
Looking back at the market performance this year, a large influx of buyers entered the market when gold prices fell to $4099.02 on March 23. It then rebounded all the way to a high of $4889.24 on April 17 before encountering resistance and falling back. In May, it faced a second strong resistance level near $4773.37 and fell back again. This shows that demand in the gold market has not completely subsided; the current market movement is merely a revaluation in a high-interest-rate environment, not a complete exodus of funds.
Spot Gold Technical Analysis
(Spot gold daily chart source: FX678)
Gold prices officially broke below the previous low of $4,501.04 on Monday, confirming a short-term downtrend. The $4,481.78 level is within the core range of the short-term correction from $4,401.84 to $4,495.33, and is also a key support level for the year.
From the perspective of moving average indicators, the market trends are clearly divergent:
Investors who use the 200-day moving average at $4353.55 as the core support for the long-term trend believe that the current gold price has entered a low-level entry range with small stop-loss margins and a relatively high cost-effectiveness.
Investors who use the 50-day moving average at $4705.12 as short-term trend resistance tend to short the market, predicting that gold prices are likely to fall below the 200-day moving average.
The short-term 50-day moving average continues its downward trend, gradually converging towards the slowly rising 200-day moving average. A bearish death cross is imminent, indicating an increasing risk of a medium- to long-term downtrend for gold. Currently, the 20-day moving average is at $4640.49, and the 100-day moving average is at $4793.18. The overall moving average system is bearish, with significant resistance above.
From a technical perspective, the $4481.78 level represents a 20% drop from the historical high of $5602.23, making it a widely recognized dividing line between bull and bear markets for gold. The key focus going forward is whether quantitative trading funds can sustain significant support at this price level to maintain the bull market trend. If this level is breached, the market will fully transition into a bear market.
From an indicator perspective, the current RSI is 40.03, which is in the neutral to bearish range and has not yet entered the oversold zone, indicating that there is still room for further decline in the short term. In the MACD indicator, the DIFF line is -36.60, the DEA line is -28.98, and the MACD histogram is -15.25. Although the green bars show signs of narrowing, the overall trend is still in a bearish divergence correction phase, and the rebound momentum is limited.
The support level held temporarily on Monday, leading to a rebound, but whether it can hold firm when tested multiple times remains the biggest question mark in the gold market this week.
Key areas to watch in the future
Crude oil price movements and Federal Reserve interest rate expectations remain the two core factors driving gold price movements, and both factors are currently bearish for gold.
If geopolitical tensions in the Middle East ease and international oil prices fall sharply, market inflation anxiety will cool down, the 10-year US Treasury yield is expected to fall below 4.5%, and the US dollar index will weaken accordingly. Only then will gold prices have a chance to stabilize and rebound, and challenge the $4,700 level and above.
If the geopolitical situation remains deadlocked, oil prices remain high, and high interest rate expectations persist, gold prices will continue to be under pressure.
From a technical perspective, closely monitor the bearish crossover of the 50-day and 200-day moving averages. The most crucial level remains the $4481.78 mark, a key dividing line between bullish and bearish trends. Whether this price level holds this week will directly determine the medium- to long-term direction of gold. Short-term resistance levels to watch are $4640.49 (20-day moving average) and $4705.12 (50-day moving average). Key support is at $4481.78; a break below this level would target $4353.55 (200-day moving average).
- Risk Warning and Disclaimer
- The market involves risk, and trading may not be suitable for all investors. This article is for reference only and does not constitute personal investment advice, nor does it take into account certain users’ specific investment objectives, financial situation, or other needs. Any investment decisions made based on this information are at your own risk.