The yield on 10-year US Treasury bonds is under pressure at high levels, and a downward correction is highly probable.
2026-05-20 20:41:46
Recently, the yield on 10-year US Treasury bonds has continued its strong upward trend, breaking through the upper rail of the narrow Bollinger Bands for four consecutive days, and continuously fluctuating within the extremely strong range between the two upper rails, once reaching a stage high of 4.682. However, it is worth noting that in this high-level area, the market has simultaneously formed a complex candlestick pattern of a high-level inside bar and an inverted hammer candlestick, strongly resonating with the overbought signal of the Bollinger Bands. This multiple technical warning suggests that this round of strong upward movement is coming to an end, and the short-term bullish and bearish pattern will undergo a fundamental change, with a volatile pullback becoming the mainstream expectation for the subsequent trend. This article will combine three core technical indicators—the Bollinger Bands, the inside bar, and the inverted hammer—with the current macroeconomic fundamentals to comprehensively analyze the future trend logic of the 10-year US Treasury yield.
A triple technical convergence: a warning sign of the end of a strong uptrend.
The core value of technical analysis lies in capturing turning points in the balance of power between bulls and bears. The warning significance of a single indicator is limited. When the Bollinger Bands and candlestick patterns resonate, the reliability of the signal increases significantly. The current chart of the 10-year US Treasury yield is a typical example of a double resonance pattern of "overbought trend + warning pattern," with the three indicators mutually confirming each other and pointing towards a trend of high-level pressure.
Double Bollinger Bands: Extreme overbought conditions lock in the upper limit of the upside.
The Double Bollinger Bands (DBB) are a core tool for measuring trend strength and range-bound volatility. They consist of a narrow Bollinger Band (short-term sentiment band) and a wide Bollinger Band (medium-term trend band). Their core logic is to precisely divide the strong and weak phases of a bullish trend through the layering of the bands. The recent rise in the 10-year US Treasury yield perfectly aligns with the strong market pattern observed with the Double Bollinger Bands, exhibiting clear phased characteristics from initiation and acceleration to exhaustion.
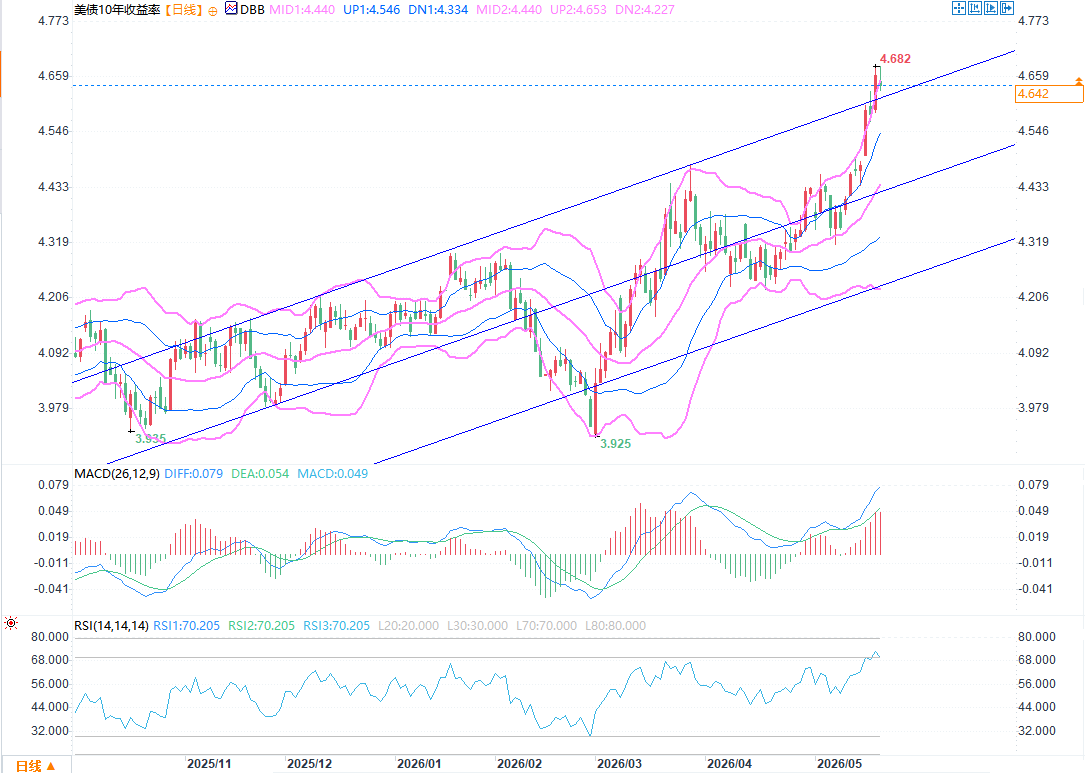
From a trend perspective, this round of market movement began near the middle band of the double Bollinger Bands. After the price stabilized above the narrow upper band, it entered a bullish acceleration zone, with four consecutive candlesticks breaking through the narrow upper band and continuously trading between the narrow and wide upper bands. This is the most extreme bullish performance within the double Bollinger Band system, indicating euphoric bullish sentiment and extremely strong short-term trend dominance. However, behind this extreme strength lies the continuous accumulation of overbought risk—the current price is approaching the wide upper band (around 4.651), which serves as the ultimate resistance level for the medium-term trend. Historical data shows that when the price breaks through the narrow upper band and touches the wide upper band, a technical pullback occurs more than 80% of the time, returning to the inner range of the Bollinger Bands.
More importantly, the overbought condition of the double Bollinger Bands has reached extreme levels, and the deviation between the price and the upper band of the narrow band continues to widen, indicating a strong need for "correction" in the short term. Considering the current pricing logic of the US Treasury market, yields above 4.5% are gradually approaching the long-term interest rate center, and further upward movement lacks sufficient momentum. The constraints of the double Bollinger Bands have essentially locked in the ceiling for short-term gains.
High-level inside bar: Increased divergence between bulls and bears, upward momentum weakening.
Against the backdrop of overbought conditions indicated by the double Bollinger Bands, a high-level harami (or inside bar) pattern simultaneously appeared on the chart, becoming the first clear signal of weakening bullish momentum. The harami pattern, also known as a "pregnant woman," consists of two candlesticks: the first is a relatively long "mother" candlestick (in this case, a large bullish candlestick), and the second is a smaller "child" candlestick completely engulfed by the mother candlestick. Its core meaning is that the balance of power between buyers and sellers has shifted from one-sided dominance to equilibrium, and the trend has entered a pause phase.
The recent appearance of a bullish engulfing pattern on the chart is a typical "strong bullish engulfing pattern at a high level"—the smaller candlestick's body falls in the upper-middle section of the larger candlestick's body. This characteristic indicates that the bulls have not completely collapsed, and there is still support below, meaning a sharp drop is unlikely in the short term. However, the upward momentum has significantly weakened. Looking back at this round of gains, the previous consecutive large bullish candlesticks demonstrated the absolute dominance of the bulls. The appearance of the engulfing pattern signifies that bullish funds are beginning to dry up, with insufficient willingness to chase higher prices, and the market has shifted from a "one-sided upward trend" to a "battle between bulls and bears."
It's important to note that the warning significance of a Harami pattern is closely related to its location. In areas of continuous sharp rises and extreme overbought conditions with both Bollinger Bands, a Harami pattern is not a continuation signal, but rather a transitional signal indicating a trend reversal. Considering the current pricing environment for US Treasury yields, while fundamental factors such as sticky inflation and the Fed's hawkish stance support high interest rates, they are unlikely to drive yields further upwards at an accelerated pace. The appearance of a Harami pattern directly reflects this stalemate between bulls and bears, characterized by "weak upward momentum and insufficient downward movement."
Inverted hammer candlestick pattern: High-level selling pressure is evident, confirming a market top.
(Chart of 10-year US Treasury yield - Source: EFX)
When combined with a high-level harami pattern, it forms an inverted hammer-like pattern, further reinforcing the warning signal of a top at the high level. The core characteristics of an inverted hammer are a relatively small body and a long upper shadow (usually more than twice the length of the body). When it appears at a high level, it is also called a "shooting star." Its essence is a signal that after an intraday surge, heavy selling pressure is encountered, trapping those who chased the price higher, and the bearish forces begin to gradually exert their strength.
Although the candlestick pattern in this instance is not a standard inverted hammer, it perfectly matches the core characteristics of "high price level + long upper shadow + small body"—the price once surged to a temporary high of 4.682, but was subsequently driven back by heavy selling pressure, ultimately closing with a small-bodied candlestick. The long upper shadow clearly reflects the heavy selling pressure above. This pattern complements the Harami pattern: the Harami pattern reflects the hesitation and weakness of the bulls, while the inverted hammer confirms the bears' counterattack and the concentrated release of selling pressure. The combination of these two patterns forms a double topping warning, significantly increasing the reliability of the signal.
From a market perspective, the long upper shadow of an inverted hammer candlestick pattern essentially represents a concentrated sell-off by early profit-takers and those trapped at higher levels. With the 10-year US Treasury yield rising above 4.6%, early long positions have yielded substantial profits, leading to a strong desire to lock in gains. Simultaneously, the previous high around 4.682 formed strong resistance, with trapped positions selling off at this level, further suppressing price increases. This dual selling pressure contributed to the formation of the inverted hammer-like candlestick pattern, indicating that the short-term upward trend is unlikely to continue.
Macroeconomic fundamentals support the core logic of high-level consolidation rather than a sharp decline.
Despite strong technical warnings of a market top, the 10-year US Treasury yield is unlikely to experience a sharp drop in the short term, given the current macroeconomic fundamentals. Instead, it is expected to fluctuate at high levels and gradually decline. The core reasons for this are the support from factors such as persistent inflation, the Federal Reserve's policy stance, and geopolitical factors. This also explains the pattern of "bulls having support and bears having difficulty exerting force" at high levels.
From an inflation perspective, while US inflation is generally on a downward trend, stickiness remains. In April 2026, the overall US CPI rose to 3.8% year-on-year, while the core CPI recorded a 0.4% month-on-month increase, the largest monthly increase this year. The sticky price CPI tracked by the Atlanta Fed reached an annualized month-on-month increase of 4.6%, indicating that inflationary pressures have deeply penetrated into slow-moving variables such as rents and services. This stickiness means the Federal Reserve is unlikely to quickly initiate a rate-cutting cycle, and market expectations for "high interest rates for a longer period" continue to rise. This provides some support for US Treasury yields and also determines that a sharp decline is unlikely.
From the perspective of Federal Reserve policy, the new Chairman Warsh has adopted a hawkish stance since taking office, emphasizing that "inflation remains a core issue for American households," suggesting that the Fed will maintain a tight monetary policy, and expectations for interest rate cuts this year have once again dropped to zero. This hawkish stance has further strengthened market expectations for high interest rates, limiting the downside potential of US Treasury yields. Meanwhile, the US fiscal deficit remains high, reaching $1.8 trillion in fiscal year 2025. The Treasury has significantly increased the issuance of Treasury bonds, and the pressure on the supply of long-term coupon bonds has been transmitted to long-term yields, also providing support for yields.
Furthermore, geopolitical factors have also provided short-term support for US Treasury yields. The US-Iran conflict has entered a protracted phase of alternating fighting and negotiations, market concerns about passage through the Strait of Hormuz persist, and the tail risk of rising oil prices has pushed up the term premium for US Treasuries. The market is pricing in geopolitical risks as a persistent factor, further supporting the high levels of long-term yields. The combination of these fundamental factors suggests that the 10-year US Treasury yield will not experience a sharp drop in the short term, but rather will gradually decline after fluctuating at high levels.
Future Trend Forecast: A clear three-stage path, with a pullback as the main theme.
Based on the triple resonance signal from the technical aspects and the support from macroeconomic fundamentals, the future trend of the 10-year US Treasury yield will be divided into three clear stages, generally presenting a pattern of "high-level consolidation and topping out – technical pullback – trend confirmation". The consolidation and pullback will be the main theme of the subsequent trend, and the specific path is deduced as follows:
Phase 1: High-level consolidation and topping out (short term 1-3 trading days)
In the short term, the 10-year US Treasury yield is expected to remain range-bound and consolidate within the 4.60-4.68% range. On one hand, overbought technical pressure and selling pressure need to be digested, and profit-taking by longs and selling by shorts will cause repeated price fluctuations. On the other hand, the existence of support from macroeconomic fundamentals makes it difficult for shorts to mount an effective counterattack, and prices will not quickly break through key support levels. The key point to observe at this stage is the support strength of the narrow Bollinger Band upper rail (4.546) – as long as the closing price remains above the narrow upper rail, the consolidation pattern will continue; if the closing price falls below the narrow upper rail, the consolidation phase will end, and a pullback will officially begin.
Phase Two: Technical pullback (3-7 trading days in the medium term)
As overbought pressure continues to ease and selling pressure gradually accumulates, the 10-year US Treasury yield will break out of its trading range and enter a technical pullback phase. The first target for this pullback is the middle Bollinger Band (around 4.440), which is a key dividing line between bullish and bearish sentiment in the medium term and the starting point of the previous upward trend. A support rebound is highly likely to occur there. If the middle band support holds, the price may consolidate in the 4.440-4.546 range; if the middle band support fails, the pullback will deepen further, with the next target being the lower Bollinger Band (around 4.334).
Phase 3: Trend Confirmation (Long-term: 1-2 weeks)
If the price breaks below the lower Bollinger Band (4.334), it signifies a complete breakdown of the strong double Bollinger Band structure, officially shifting the medium-term trend from bullish to bearish. The 10-year US Treasury yield will then enter a sustained decline, with the next target near the previous low of 3.925. If the price finds effective support at the middle or lower Bollinger Band and rebounds, regaining its footing above the upper Bollinger Band, it may re-enter a high-level consolidation pattern. However, considering the overbought technical risk and the strength of fundamental support, this probability is relatively low.
Conclusions and Outlook
Considering the combined signals from three major technical indicators—the double Bollinger Bands, the high-level inside bar, and the inverted hammer candlestick pattern—as well as the combined influence of macroeconomic fundamentals such as inflation stickiness, Federal Reserve policy, and geopolitics, the 10-year US Treasury yield is currently at a critical juncture in this round of strong upward movement. A short-term high-level consolidation and gradual decline is the most probable trend. However, the possibility of breaking through the previous high (4.682) and continuing the strong upward trend cannot be completely ruled out. Both trends require a comprehensive judgment based on technical signals and changes in fundamentals. There is no absolutely one-sided market trend.
In the short term, the main characteristic is high-level consolidation and topping out. The struggle within the 4.60-4.68 range will directly determine the subsequent direction: On the one hand, the upper Bollinger Band (4.546) is a key support level. Once the closing price breaks through this level, a pullback will officially begin, with the first target pointing to the middle Bollinger Band (around 4.440). On the other hand, if the overbought pressure and selling pressure can be digested within this range, and a breakout signal with increased volume appears, the 10-year US Treasury yield is expected to break through the previous high of 4.682, continuing its strong upward trend. The core support for breaking through the previous high lies in further positive fundamentals, including continued higher-than-expected US core inflation, further strengthening of the Fed's hawkish stance, and the escalation of the US-Iran conflict pushing up oil prices and term premiums. These factors will reignite bullish momentum, pushing the yield to break through the resistance of the upper Bollinger Band (around 4.651), opening up new upward space, with a short-term target around 4.773. In the medium to long term, if the previous high is broken and held, it will mean that the long-term interest rate center will move further upward, and the yield may remain in the high range of 4.6%-4.8%. If it fails to break through and falls back, with inflation gradually declining, the Fed's policy marginally adjusting, and the gradual emergence of negative economic feedback, the 10-year US Treasury yield is expected to gradually return to the reasonable range of 4.0%-4.5%, and in the short term, the overall high-level game pattern will still be maintained.
For investors, it's crucial to abandon one-sided thinking and consider both pullbacks and breakouts, focusing on three key signals: First, the battle between bulls and bears in the 4.60-4.68 range. If the price breaks below 4.546, short positions can be considered; if the price finds support near 4.440, short-term buying can be considered, but position size should be controlled, and the risk of a trend reversal should be guarded against. Second, the validity of breakout signals. If a high-volume bullish candle breaks through the previous high of 4.682 and holds above the upper Bollinger Band, a small long position can be taken to capitalize on further upward potential, but the risk of a rapid pullback after overbought conditions should be noted, as the current technical overbought pattern remains unchanged, and profit-taking pressure still exists after consecutive breakouts. Third, fundamental changes. Closely monitor US inflation data, statements from Federal Reserve officials, and the progress of the US-Iran conflict, as these factors are the core variables determining whether a breakout of the previous high will occur.
Overall, the 10-year US Treasury yield has moved beyond its period of strong, one-sided growth and entered a phase of high-level bull-bear struggle. A volatile decline remains the prevailing expectation, but the possibility of breaking through previous highs should also be closely monitored. Investors need to adapt to market volatility under the normal conditions of high interest rates, rationally respond to the uncertainties brought about by the bull-bear struggle, and flexibly adjust their trading strategies.
A triple technical convergence: a warning sign of the end of a strong uptrend.
The core value of technical analysis lies in capturing turning points in the balance of power between bulls and bears. The warning significance of a single indicator is limited. When the Bollinger Bands and candlestick patterns resonate, the reliability of the signal increases significantly. The current chart of the 10-year US Treasury yield is a typical example of a double resonance pattern of "overbought trend + warning pattern," with the three indicators mutually confirming each other and pointing towards a trend of high-level pressure.
Double Bollinger Bands: Extreme overbought conditions lock in the upper limit of the upside.
The Double Bollinger Bands (DBB) are a core tool for measuring trend strength and range-bound volatility. They consist of a narrow Bollinger Band (short-term sentiment band) and a wide Bollinger Band (medium-term trend band). Their core logic is to precisely divide the strong and weak phases of a bullish trend through the layering of the bands. The recent rise in the 10-year US Treasury yield perfectly aligns with the strong market pattern observed with the Double Bollinger Bands, exhibiting clear phased characteristics from initiation and acceleration to exhaustion.
From a trend perspective, this round of market movement began near the middle band of the double Bollinger Bands. After the price stabilized above the narrow upper band, it entered a bullish acceleration zone, with four consecutive candlesticks breaking through the narrow upper band and continuously trading between the narrow and wide upper bands. This is the most extreme bullish performance within the double Bollinger Band system, indicating euphoric bullish sentiment and extremely strong short-term trend dominance. However, behind this extreme strength lies the continuous accumulation of overbought risk—the current price is approaching the wide upper band (around 4.651), which serves as the ultimate resistance level for the medium-term trend. Historical data shows that when the price breaks through the narrow upper band and touches the wide upper band, a technical pullback occurs more than 80% of the time, returning to the inner range of the Bollinger Bands.
More importantly, the overbought condition of the double Bollinger Bands has reached extreme levels, and the deviation between the price and the upper band of the narrow band continues to widen, indicating a strong need for "correction" in the short term. Considering the current pricing logic of the US Treasury market, yields above 4.5% are gradually approaching the long-term interest rate center, and further upward movement lacks sufficient momentum. The constraints of the double Bollinger Bands have essentially locked in the ceiling for short-term gains.
High-level inside bar: Increased divergence between bulls and bears, upward momentum weakening.
Against the backdrop of overbought conditions indicated by the double Bollinger Bands, a high-level harami (or inside bar) pattern simultaneously appeared on the chart, becoming the first clear signal of weakening bullish momentum. The harami pattern, also known as a "pregnant woman," consists of two candlesticks: the first is a relatively long "mother" candlestick (in this case, a large bullish candlestick), and the second is a smaller "child" candlestick completely engulfed by the mother candlestick. Its core meaning is that the balance of power between buyers and sellers has shifted from one-sided dominance to equilibrium, and the trend has entered a pause phase.
The recent appearance of a bullish engulfing pattern on the chart is a typical "strong bullish engulfing pattern at a high level"—the smaller candlestick's body falls in the upper-middle section of the larger candlestick's body. This characteristic indicates that the bulls have not completely collapsed, and there is still support below, meaning a sharp drop is unlikely in the short term. However, the upward momentum has significantly weakened. Looking back at this round of gains, the previous consecutive large bullish candlesticks demonstrated the absolute dominance of the bulls. The appearance of the engulfing pattern signifies that bullish funds are beginning to dry up, with insufficient willingness to chase higher prices, and the market has shifted from a "one-sided upward trend" to a "battle between bulls and bears."
It's important to note that the warning significance of a Harami pattern is closely related to its location. In areas of continuous sharp rises and extreme overbought conditions with both Bollinger Bands, a Harami pattern is not a continuation signal, but rather a transitional signal indicating a trend reversal. Considering the current pricing environment for US Treasury yields, while fundamental factors such as sticky inflation and the Fed's hawkish stance support high interest rates, they are unlikely to drive yields further upwards at an accelerated pace. The appearance of a Harami pattern directly reflects this stalemate between bulls and bears, characterized by "weak upward momentum and insufficient downward movement."
Inverted hammer candlestick pattern: High-level selling pressure is evident, confirming a market top.
(Chart of 10-year US Treasury yield - Source: EFX)
When combined with a high-level harami pattern, it forms an inverted hammer-like pattern, further reinforcing the warning signal of a top at the high level. The core characteristics of an inverted hammer are a relatively small body and a long upper shadow (usually more than twice the length of the body). When it appears at a high level, it is also called a "shooting star." Its essence is a signal that after an intraday surge, heavy selling pressure is encountered, trapping those who chased the price higher, and the bearish forces begin to gradually exert their strength.
Although the candlestick pattern in this instance is not a standard inverted hammer, it perfectly matches the core characteristics of "high price level + long upper shadow + small body"—the price once surged to a temporary high of 4.682, but was subsequently driven back by heavy selling pressure, ultimately closing with a small-bodied candlestick. The long upper shadow clearly reflects the heavy selling pressure above. This pattern complements the Harami pattern: the Harami pattern reflects the hesitation and weakness of the bulls, while the inverted hammer confirms the bears' counterattack and the concentrated release of selling pressure. The combination of these two patterns forms a double topping warning, significantly increasing the reliability of the signal.
From a market perspective, the long upper shadow of an inverted hammer candlestick pattern essentially represents a concentrated sell-off by early profit-takers and those trapped at higher levels. With the 10-year US Treasury yield rising above 4.6%, early long positions have yielded substantial profits, leading to a strong desire to lock in gains. Simultaneously, the previous high around 4.682 formed strong resistance, with trapped positions selling off at this level, further suppressing price increases. This dual selling pressure contributed to the formation of the inverted hammer-like candlestick pattern, indicating that the short-term upward trend is unlikely to continue.
Macroeconomic fundamentals support the core logic of high-level consolidation rather than a sharp decline.
Despite strong technical warnings of a market top, the 10-year US Treasury yield is unlikely to experience a sharp drop in the short term, given the current macroeconomic fundamentals. Instead, it is expected to fluctuate at high levels and gradually decline. The core reasons for this are the support from factors such as persistent inflation, the Federal Reserve's policy stance, and geopolitical factors. This also explains the pattern of "bulls having support and bears having difficulty exerting force" at high levels.
From an inflation perspective, while US inflation is generally on a downward trend, stickiness remains. In April 2026, the overall US CPI rose to 3.8% year-on-year, while the core CPI recorded a 0.4% month-on-month increase, the largest monthly increase this year. The sticky price CPI tracked by the Atlanta Fed reached an annualized month-on-month increase of 4.6%, indicating that inflationary pressures have deeply penetrated into slow-moving variables such as rents and services. This stickiness means the Federal Reserve is unlikely to quickly initiate a rate-cutting cycle, and market expectations for "high interest rates for a longer period" continue to rise. This provides some support for US Treasury yields and also determines that a sharp decline is unlikely.
From the perspective of Federal Reserve policy, the new Chairman Warsh has adopted a hawkish stance since taking office, emphasizing that "inflation remains a core issue for American households," suggesting that the Fed will maintain a tight monetary policy, and expectations for interest rate cuts this year have once again dropped to zero. This hawkish stance has further strengthened market expectations for high interest rates, limiting the downside potential of US Treasury yields. Meanwhile, the US fiscal deficit remains high, reaching $1.8 trillion in fiscal year 2025. The Treasury has significantly increased the issuance of Treasury bonds, and the pressure on the supply of long-term coupon bonds has been transmitted to long-term yields, also providing support for yields.
Furthermore, geopolitical factors have also provided short-term support for US Treasury yields. The US-Iran conflict has entered a protracted phase of alternating fighting and negotiations, market concerns about passage through the Strait of Hormuz persist, and the tail risk of rising oil prices has pushed up the term premium for US Treasuries. The market is pricing in geopolitical risks as a persistent factor, further supporting the high levels of long-term yields. The combination of these fundamental factors suggests that the 10-year US Treasury yield will not experience a sharp drop in the short term, but rather will gradually decline after fluctuating at high levels.
Future Trend Forecast: A clear three-stage path, with a pullback as the main theme.
Based on the triple resonance signal from the technical aspects and the support from macroeconomic fundamentals, the future trend of the 10-year US Treasury yield will be divided into three clear stages, generally presenting a pattern of "high-level consolidation and topping out – technical pullback – trend confirmation". The consolidation and pullback will be the main theme of the subsequent trend, and the specific path is deduced as follows:
Phase 1: High-level consolidation and topping out (short term 1-3 trading days)
In the short term, the 10-year US Treasury yield is expected to remain range-bound and consolidate within the 4.60-4.68% range. On one hand, overbought technical pressure and selling pressure need to be digested, and profit-taking by longs and selling by shorts will cause repeated price fluctuations. On the other hand, the existence of support from macroeconomic fundamentals makes it difficult for shorts to mount an effective counterattack, and prices will not quickly break through key support levels. The key point to observe at this stage is the support strength of the narrow Bollinger Band upper rail (4.546) – as long as the closing price remains above the narrow upper rail, the consolidation pattern will continue; if the closing price falls below the narrow upper rail, the consolidation phase will end, and a pullback will officially begin.
Phase Two: Technical pullback (3-7 trading days in the medium term)
As overbought pressure continues to ease and selling pressure gradually accumulates, the 10-year US Treasury yield will break out of its trading range and enter a technical pullback phase. The first target for this pullback is the middle Bollinger Band (around 4.440), which is a key dividing line between bullish and bearish sentiment in the medium term and the starting point of the previous upward trend. A support rebound is highly likely to occur there. If the middle band support holds, the price may consolidate in the 4.440-4.546 range; if the middle band support fails, the pullback will deepen further, with the next target being the lower Bollinger Band (around 4.334).
Phase 3: Trend Confirmation (Long-term: 1-2 weeks)
If the price breaks below the lower Bollinger Band (4.334), it signifies a complete breakdown of the strong double Bollinger Band structure, officially shifting the medium-term trend from bullish to bearish. The 10-year US Treasury yield will then enter a sustained decline, with the next target near the previous low of 3.925. If the price finds effective support at the middle or lower Bollinger Band and rebounds, regaining its footing above the upper Bollinger Band, it may re-enter a high-level consolidation pattern. However, considering the overbought technical risk and the strength of fundamental support, this probability is relatively low.
Conclusions and Outlook
Considering the combined signals from three major technical indicators—the double Bollinger Bands, the high-level inside bar, and the inverted hammer candlestick pattern—as well as the combined influence of macroeconomic fundamentals such as inflation stickiness, Federal Reserve policy, and geopolitics, the 10-year US Treasury yield is currently at a critical juncture in this round of strong upward movement. A short-term high-level consolidation and gradual decline is the most probable trend. However, the possibility of breaking through the previous high (4.682) and continuing the strong upward trend cannot be completely ruled out. Both trends require a comprehensive judgment based on technical signals and changes in fundamentals. There is no absolutely one-sided market trend.
In the short term, the main characteristic is high-level consolidation and topping out. The struggle within the 4.60-4.68 range will directly determine the subsequent direction: On the one hand, the upper Bollinger Band (4.546) is a key support level. Once the closing price breaks through this level, a pullback will officially begin, with the first target pointing to the middle Bollinger Band (around 4.440). On the other hand, if the overbought pressure and selling pressure can be digested within this range, and a breakout signal with increased volume appears, the 10-year US Treasury yield is expected to break through the previous high of 4.682, continuing its strong upward trend. The core support for breaking through the previous high lies in further positive fundamentals, including continued higher-than-expected US core inflation, further strengthening of the Fed's hawkish stance, and the escalation of the US-Iran conflict pushing up oil prices and term premiums. These factors will reignite bullish momentum, pushing the yield to break through the resistance of the upper Bollinger Band (around 4.651), opening up new upward space, with a short-term target around 4.773. In the medium to long term, if the previous high is broken and held, it will mean that the long-term interest rate center will move further upward, and the yield may remain in the high range of 4.6%-4.8%. If it fails to break through and falls back, with inflation gradually declining, the Fed's policy marginally adjusting, and the gradual emergence of negative economic feedback, the 10-year US Treasury yield is expected to gradually return to the reasonable range of 4.0%-4.5%, and in the short term, the overall high-level game pattern will still be maintained.
For investors, it's crucial to abandon one-sided thinking and consider both pullbacks and breakouts, focusing on three key signals: First, the battle between bulls and bears in the 4.60-4.68 range. If the price breaks below 4.546, short positions can be considered; if the price finds support near 4.440, short-term buying can be considered, but position size should be controlled, and the risk of a trend reversal should be guarded against. Second, the validity of breakout signals. If a high-volume bullish candle breaks through the previous high of 4.682 and holds above the upper Bollinger Band, a small long position can be taken to capitalize on further upward potential, but the risk of a rapid pullback after overbought conditions should be noted, as the current technical overbought pattern remains unchanged, and profit-taking pressure still exists after consecutive breakouts. Third, fundamental changes. Closely monitor US inflation data, statements from Federal Reserve officials, and the progress of the US-Iran conflict, as these factors are the core variables determining whether a breakout of the previous high will occur.
Overall, the 10-year US Treasury yield has moved beyond its period of strong, one-sided growth and entered a phase of high-level bull-bear struggle. A volatile decline remains the prevailing expectation, but the possibility of breaking through previous highs should also be closely monitored. Investors need to adapt to market volatility under the normal conditions of high interest rates, rationally respond to the uncertainties brought about by the bull-bear struggle, and flexibly adjust their trading strategies.
- Risk Warning and Disclaimer
- The market involves risk, and trading may not be suitable for all investors. This article is for reference only and does not constitute personal investment advice, nor does it take into account certain users’ specific investment objectives, financial situation, or other needs. Any investment decisions made based on this information are at your own risk.