PCE overnight surge: Monthly rate "brakes," annual rate "accelerates," who pays for gold's $10 surge?
2026-05-28 20:46:55
On Thursday (May 28), at 8:30 PM Beijing time, the U.S. Department of Commerce released the April PCE price index data. This data, as the Federal Reserve's most closely watched inflation indicator, is highly anticipated by the market. Also released at the same time are the revised first-quarter GDP figure, April personal income and spending, durable goods orders, and initial jobless claims, among other data.

Prior to the data release, the market had largely priced in a rise in the core PCE annual rate to 3.3%, primarily driven by energy price transmission and the impact of some service costs. Stock index futures remained generally stable, with Dow Jones, Nasdaq, and S&P 500 futures experiencing slight fluctuations. The US dollar index hovered around 99.5, while spot gold maintained high-level volatility, supported by energy-related geopolitical factors. Investors focused on whether the data would further increase the probability of a Fed rate hike and the actual performance of economic growth momentum.
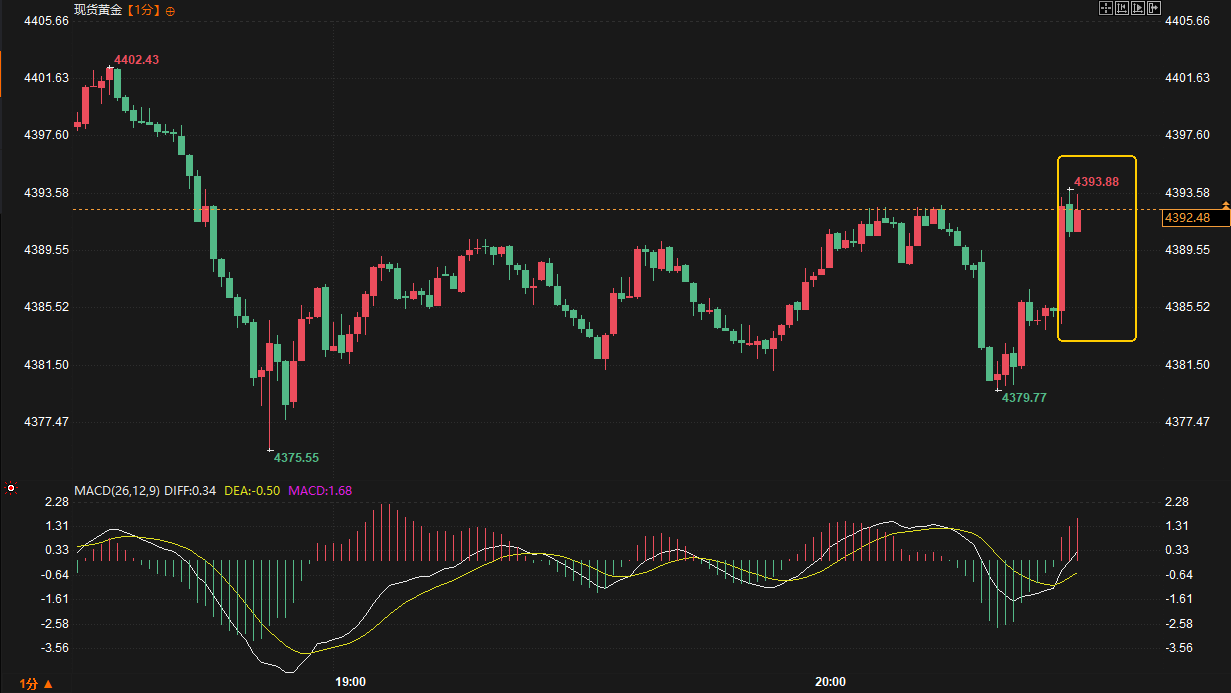
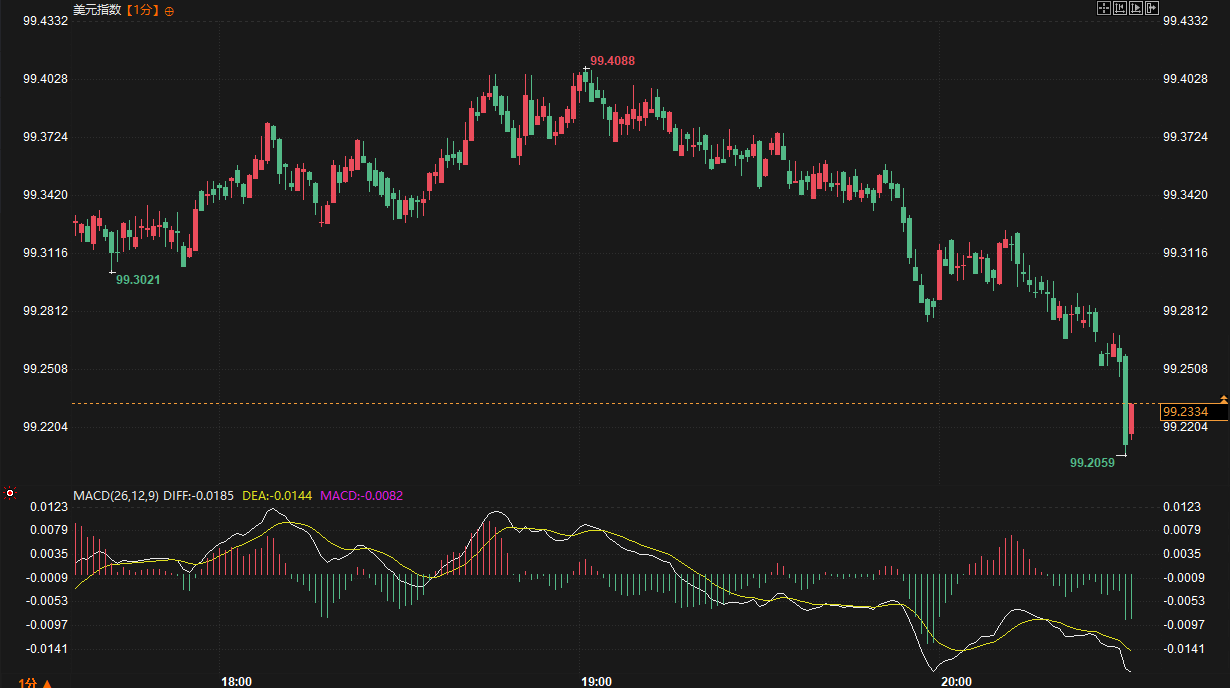
Following the release of the data, US stock futures retreated slightly, with Dow Jones futures down about 0.25%, Nasdaq futures down 0.2%, and S&P 500 futures down 0.14%. The US dollar index (DXY) edged lower to around 99.22, while spot gold rose nearly $10 in the short term, reaching a high of $4393.6 per ounce. Overall, the market reaction was mild, indicating that the data was largely in line with expectations and did not trigger significant volatility.
Core PCE data showed a pattern of "slowing monthly growth and rising annual growth." The core PCE price index rose 0.2% month-on-month in April, lower than the expected 0.3% and the previous value of 0.3%; the annual growth rate rose to 3.3%, in line with expectations and higher than the previous value of 3.2%, reaching a new high since November 2023. The headline PCE annual growth rate was 3.8%, in line with expectations and higher than the previous value of 3.5%; the monthly growth rate was 0.4%, lower than the expected 0.5%.
This combination suggests that short-term price pressures have eased somewhat, but the sticky trend of inflation remains. The lower-than-expected monthly rate was mainly due to the weakening of prices for some goods and services month-on-month, while the rise in the annual rate reflects the base effect and the lagged transmission of energy costs. Compared with historical trends, the current core PCE annual rate is close to the high point at the end of 2023, when the Federal Reserve maintained a restrictive policy stance for a longer period. The moderate monthly rate provided some buffer for the market, but the rise in the annual rate continues the signal that inflation has returned to an upward trajectory recently.
Other data points provide a complementary picture. The revised annualized quarterly rate of real GDP for the first quarter was 1.6%, lower than both expectations and the previous figure, indicating a slowdown in economic growth momentum. Initial corporate profits turned negative, and the quarterly rate of personal consumption expenditure was also revised downward. Meanwhile, durable goods orders jumped sharply to 7.9% month-on-month in April, far exceeding expectations, mainly driven by a surge in orders for transportation equipment, particularly non-defense aircraft, reflecting localized resilience in the manufacturing sector. Initial jobless claims were 215,000, slightly higher than expected, but the overall labor market remained stable.
The perspectives of prominent institutions diverged significantly before and after the data release. Prior to the release, most institutions emphasized the risk of unexpected inflation driven by energy prices, and the market gradually increased its pricing of a Fed rate hike this year. After the release, institutions generally acknowledged that the moderate monthly rate released some positive signals, but also warned that the new high annual rate meant that the path of policy easing still faced constraints. Some analyses pointed out that the combination of soft growth and moderate inflation provides support for the "soft landing" narrative, but continued disturbances from energy factors should be noted.
Retail investors' opinions were more emotionally driven. Before the release, some traders expressed concern that the data was "overly bullish," worrying that rising interest rate hike expectations would suppress risk assets. After the release, retail investors focused more on the lower-than-expected monthly rate, interpreting it as a potential positive, and some discussions shifted to increased flexibility in the Fed's future policies. The difference in expectations between institutional and retail investors mainly lies in their weighting of "sticky inflation": institutions focus more on trend continuation, while retail investors pay more attention to short-term data surprises. Overall, the data did not deviate significantly from the consensus, reducing extreme reactions.
Technically, stock index futures retreated slightly but did not break out of the recent trading range, indicating a temporary balance between bullish and bearish forces. Gold rose briefly after the data release, reflecting safe-haven demand and inflation hedging demand. The US dollar index declined slightly, consistent with a minor adjustment in interest rate expectations. The long-term and short-term logics are consistent: short-term data has moderately eased some pressure, while the medium-term trend still needs to be verified by subsequent inflation and growth data.
Overall, the current economic situation presents a pattern of slowing but not stalled growth, with persistent but easing monthly inflationary pressures. In the short term, market focus may shift to subsequent statements from Federal Reserve officials and corporate earnings season performance. If subsequent data continues to confirm the resilience of growth and the moderate inflation trend, stock indices may maintain a range-bound, slightly bullish pattern; gold, on the other hand, will seek direction amidst risk aversion and fluctuations in real yields. The US dollar index may continue its weak and volatile trend in the short term. In the medium to long term, it is necessary to continuously monitor the transmission effects of energy prices, geopolitical factors, and policy responses on macroeconomic variables; market movements will revolve around data verification and expectation adjustments.
Q: What does the lower-than-expected core PCE monthly rate mean for the market?
A: The monthly rate of 0.2% was lower than the expected 0.3%, which alleviated market concerns about accelerating price pressures in the short term and provided some breathing room for risk assets. However, the annual rate still rebounded to 3.3%, indicating that the overall inflation trend has not fundamentally reversed. The market sees it more as a neutral to slightly positive signal than a trend reversal.
Q: How should we interpret the downward revision of GDP and the surge in durable goods orders in a coordinated manner?
A: The downward revision of GDP reflects a weakening in consumption and investment, indicating a marginal slowdown in economic momentum; the unexpected surge in durable goods orders mainly came from specific sectors such as aircraft, reflecting the structural resilience of the manufacturing industry. The combination of these two factors suggests that the economy is not experiencing a comprehensive downturn, but rather a differentiated pattern, which helps the market maintain expectations of a "soft landing."
Q: Why did gold prices rise in the short term after the data was released?
A: Although the annual core inflation rate has rebounded, the moderate monthly rate coupled with a downward revision of GDP has reduced expectations of extreme tightening. Meanwhile, some positive factors in other data (such as slightly higher initial jobless claims) supported safe-haven demand, pushing gold prices higher in the short term. Future price movements will still depend on real yields and the dynamics of the US dollar.
Q: Will this cause a major change in the Fed's policy path?
A: Current data is in line with mainstream expectations and does not provide a sufficiently strong signal to change the policy framework. The Federal Reserve is likely to maintain its data-dependent stance, focusing on subsequent inflation stickiness and growth balance. The probability of policy adjustments this year will be gradually revised based on cumulative data, rather than determined by a single data release.
Q: What follow-up indicators should investors pay close attention to?
A: It's crucial to closely monitor inflation data for May and June, the employment report, non-farm payroll data, as well as the minutes of the Federal Reserve meeting and speeches by officials. Meanwhile, corporate earnings reports will also influence market pricing based on their guidance for economic growth. Given the cross-asset linkages, the interaction between the US dollar, bond yields, and commodity prices warrants continued observation.
Market Background
Prior to the data release, the market had largely priced in a rise in the core PCE annual rate to 3.3%, primarily driven by energy price transmission and the impact of some service costs. Stock index futures remained generally stable, with Dow Jones, Nasdaq, and S&P 500 futures experiencing slight fluctuations. The US dollar index hovered around 99.5, while spot gold maintained high-level volatility, supported by energy-related geopolitical factors. Investors focused on whether the data would further increase the probability of a Fed rate hike and the actual performance of economic growth momentum.
Following the release of the data, US stock futures retreated slightly, with Dow Jones futures down about 0.25%, Nasdaq futures down 0.2%, and S&P 500 futures down 0.14%. The US dollar index (DXY) edged lower to around 99.22, while spot gold rose nearly $10 in the short term, reaching a high of $4393.6 per ounce. Overall, the market reaction was mild, indicating that the data was largely in line with expectations and did not trigger significant volatility.
Deep interconnect analysis
Core PCE data showed a pattern of "slowing monthly growth and rising annual growth." The core PCE price index rose 0.2% month-on-month in April, lower than the expected 0.3% and the previous value of 0.3%; the annual growth rate rose to 3.3%, in line with expectations and higher than the previous value of 3.2%, reaching a new high since November 2023. The headline PCE annual growth rate was 3.8%, in line with expectations and higher than the previous value of 3.5%; the monthly growth rate was 0.4%, lower than the expected 0.5%.
This combination suggests that short-term price pressures have eased somewhat, but the sticky trend of inflation remains. The lower-than-expected monthly rate was mainly due to the weakening of prices for some goods and services month-on-month, while the rise in the annual rate reflects the base effect and the lagged transmission of energy costs. Compared with historical trends, the current core PCE annual rate is close to the high point at the end of 2023, when the Federal Reserve maintained a restrictive policy stance for a longer period. The moderate monthly rate provided some buffer for the market, but the rise in the annual rate continues the signal that inflation has returned to an upward trajectory recently.
Other data points provide a complementary picture. The revised annualized quarterly rate of real GDP for the first quarter was 1.6%, lower than both expectations and the previous figure, indicating a slowdown in economic growth momentum. Initial corporate profits turned negative, and the quarterly rate of personal consumption expenditure was also revised downward. Meanwhile, durable goods orders jumped sharply to 7.9% month-on-month in April, far exceeding expectations, mainly driven by a surge in orders for transportation equipment, particularly non-defense aircraft, reflecting localized resilience in the manufacturing sector. Initial jobless claims were 215,000, slightly higher than expected, but the overall labor market remained stable.
The perspectives of prominent institutions diverged significantly before and after the data release. Prior to the release, most institutions emphasized the risk of unexpected inflation driven by energy prices, and the market gradually increased its pricing of a Fed rate hike this year. After the release, institutions generally acknowledged that the moderate monthly rate released some positive signals, but also warned that the new high annual rate meant that the path of policy easing still faced constraints. Some analyses pointed out that the combination of soft growth and moderate inflation provides support for the "soft landing" narrative, but continued disturbances from energy factors should be noted.
Retail investors' opinions were more emotionally driven. Before the release, some traders expressed concern that the data was "overly bullish," worrying that rising interest rate hike expectations would suppress risk assets. After the release, retail investors focused more on the lower-than-expected monthly rate, interpreting it as a potential positive, and some discussions shifted to increased flexibility in the Fed's future policies. The difference in expectations between institutional and retail investors mainly lies in their weighting of "sticky inflation": institutions focus more on trend continuation, while retail investors pay more attention to short-term data surprises. Overall, the data did not deviate significantly from the consensus, reducing extreme reactions.
Technically, stock index futures retreated slightly but did not break out of the recent trading range, indicating a temporary balance between bullish and bearish forces. Gold rose briefly after the data release, reflecting safe-haven demand and inflation hedging demand. The US dollar index declined slightly, consistent with a minor adjustment in interest rate expectations. The long-term and short-term logics are consistent: short-term data has moderately eased some pressure, while the medium-term trend still needs to be verified by subsequent inflation and growth data.
Trend Outlook
Overall, the current economic situation presents a pattern of slowing but not stalled growth, with persistent but easing monthly inflationary pressures. In the short term, market focus may shift to subsequent statements from Federal Reserve officials and corporate earnings season performance. If subsequent data continues to confirm the resilience of growth and the moderate inflation trend, stock indices may maintain a range-bound, slightly bullish pattern; gold, on the other hand, will seek direction amidst risk aversion and fluctuations in real yields. The US dollar index may continue its weak and volatile trend in the short term. In the medium to long term, it is necessary to continuously monitor the transmission effects of energy prices, geopolitical factors, and policy responses on macroeconomic variables; market movements will revolve around data verification and expectation adjustments.
Frequently Asked Questions
Q: What does the lower-than-expected core PCE monthly rate mean for the market?
A: The monthly rate of 0.2% was lower than the expected 0.3%, which alleviated market concerns about accelerating price pressures in the short term and provided some breathing room for risk assets. However, the annual rate still rebounded to 3.3%, indicating that the overall inflation trend has not fundamentally reversed. The market sees it more as a neutral to slightly positive signal than a trend reversal.
Q: How should we interpret the downward revision of GDP and the surge in durable goods orders in a coordinated manner?
A: The downward revision of GDP reflects a weakening in consumption and investment, indicating a marginal slowdown in economic momentum; the unexpected surge in durable goods orders mainly came from specific sectors such as aircraft, reflecting the structural resilience of the manufacturing industry. The combination of these two factors suggests that the economy is not experiencing a comprehensive downturn, but rather a differentiated pattern, which helps the market maintain expectations of a "soft landing."
Q: Why did gold prices rise in the short term after the data was released?
A: Although the annual core inflation rate has rebounded, the moderate monthly rate coupled with a downward revision of GDP has reduced expectations of extreme tightening. Meanwhile, some positive factors in other data (such as slightly higher initial jobless claims) supported safe-haven demand, pushing gold prices higher in the short term. Future price movements will still depend on real yields and the dynamics of the US dollar.
Q: Will this cause a major change in the Fed's policy path?
A: Current data is in line with mainstream expectations and does not provide a sufficiently strong signal to change the policy framework. The Federal Reserve is likely to maintain its data-dependent stance, focusing on subsequent inflation stickiness and growth balance. The probability of policy adjustments this year will be gradually revised based on cumulative data, rather than determined by a single data release.
Q: What follow-up indicators should investors pay close attention to?
A: It's crucial to closely monitor inflation data for May and June, the employment report, non-farm payroll data, as well as the minutes of the Federal Reserve meeting and speeches by officials. Meanwhile, corporate earnings reports will also influence market pricing based on their guidance for economic growth. Given the cross-asset linkages, the interaction between the US dollar, bond yields, and commodity prices warrants continued observation.
- Risk Warning and Disclaimer
- The market involves risk, and trading may not be suitable for all investors. This article is for reference only and does not constitute personal investment advice, nor does it take into account certain users’ specific investment objectives, financial situation, or other needs. Any investment decisions made based on this information are at your own risk.