Is the gold rally a bull trap? How much further will the dollar fall? Why are oil prices fluctuating so wildly? A comprehensive explanation of the post-non-farm payrolls market logic and turning point.
2026-06-08 20:11:01
On Monday (June 8), global financial markets exhibited a clear trend of interconnected adjustments. Influenced by strong US employment data last week, market expectations for a Federal Reserve rate hike this year significantly increased, pushing the US dollar index and US Treasury yields higher at one point. Gold prices rebounded after hitting a more than two-month low. US crude oil, however, experienced significant volatility due to heightened geopolitical tensions, initially rising before falling back following related news, with short-term volatility noticeably increasing. Data showed that the 2-year US Treasury yield fluctuated around 4.15%, the US dollar index fell back to around 99.93, spot gold rebounded to around 4325, and US crude oil hovered around $91.3 per barrel. Cross-market resonance was prominent, with employment data, inflation expectations, and geopolitical factors jointly shaping the current market rhythm.

The US added 172,000 non-farm payroll jobs in May, coupled with an upward revision of April's data, indicating that the labor market was more resilient than some market expectations. A well-known foreign media report stated that this data pushed market pricing in a December rate hike by the Federal Reserve from around 45% a week ago to over 70%. The 10-year US Treasury yield rose to a two-week high, increasing the opportunity cost of holding gold. The logic suggests that the stronger-than-expected employment data reinforces the possibility that the Federal Reserve will maintain higher interest rates for a longer period, which puts direct pressure on non-yielding assets like gold, while supporting the US dollar and US Treasury yields.
Meanwhile, new developments emerged in the Middle East situation. News of actions by Israel and Iran caused oil prices to rise sharply in early trading before falling back, reflecting a mix of inflation concerns and risk aversion. Major overseas institutions analyzed that if this week's US CPI data is strong, it will further test the support level for gold. From a fundamental perspective, employment, inflation, and geopolitical factors work together to form the core logic of current market pricing.
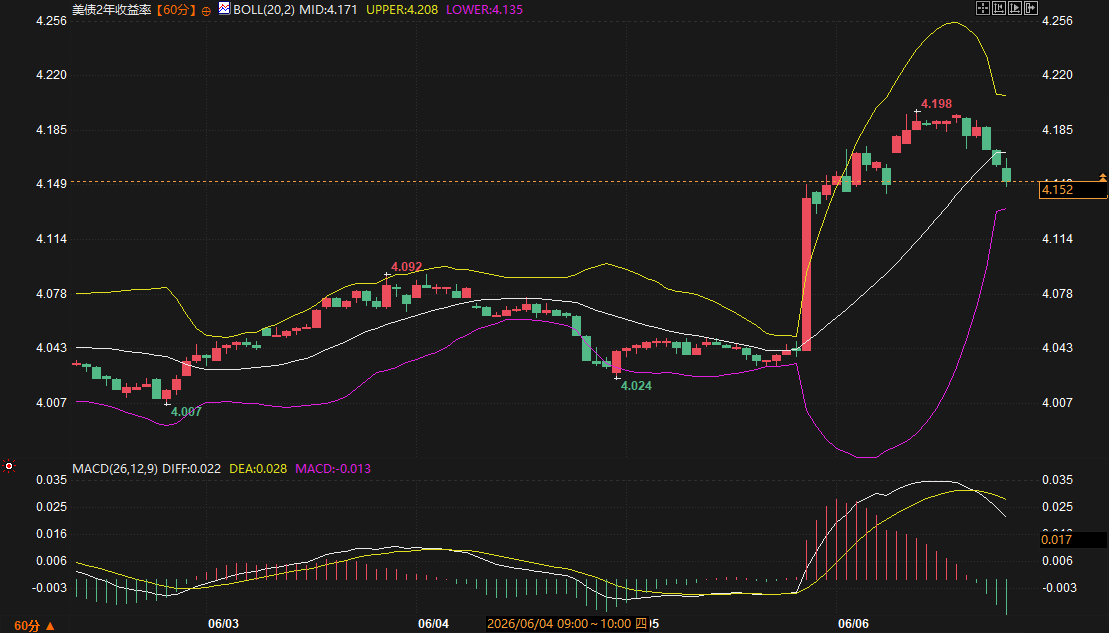
From a 60-minute technical perspective, all four maturities are showing a correction pattern after the surge and subsequent pullback on June 6th. The latest yield on the 2-year US Treasury note is 4.152%, breaking below the Bollinger Middle Band at 4.171 and currently testing the support level at 4.149. The MACD histogram has shortened significantly, and the DIFF and DEA lines have turned downwards, indicating weakening bullish momentum and a risk of further pullback in the short term. Resistance is expected in the 4.198 to 4.256 range.
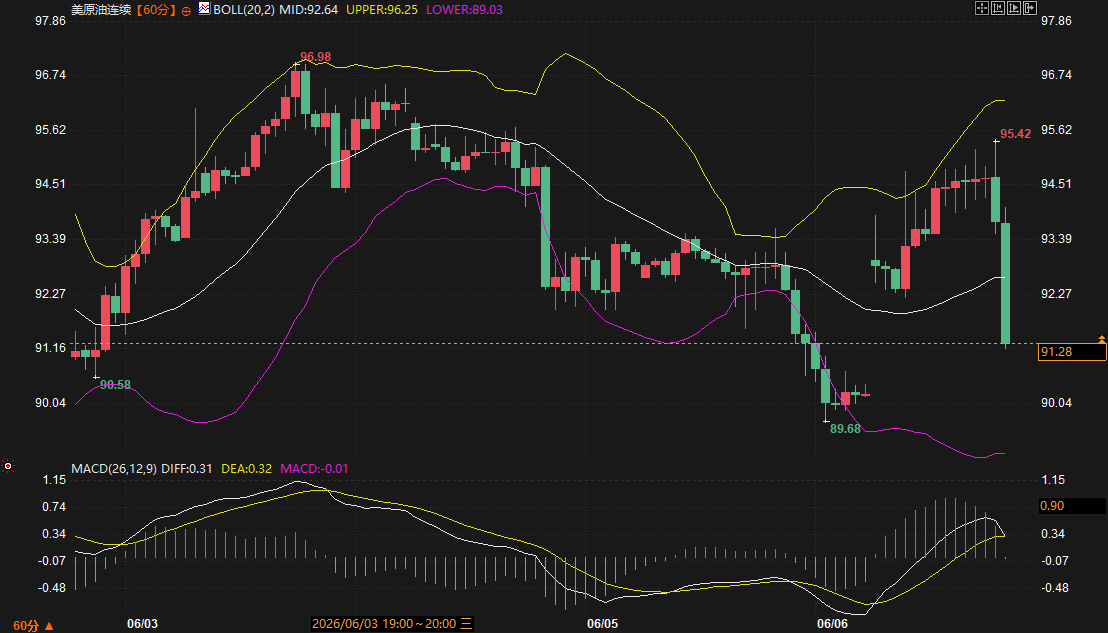
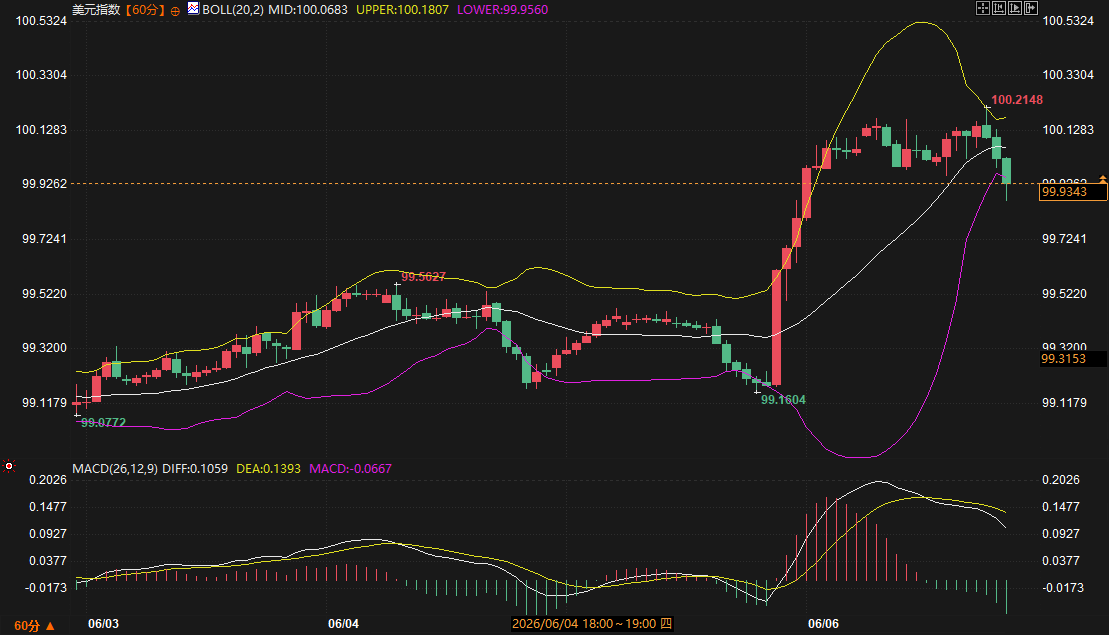
US crude oil is currently trading at $91.28, having broken below the Bollinger Middle Band at $92.64. Support levels are at the lower Bollinger Band at $89.03 and the previous low of $89.68. The MACD histogram is shortening and approaching a death cross, indicating short-term bearish pressure. The US Dollar Index has broken below the lower Bollinger Band at $99.9343, and the MACD has formed a death cross. Support levels to watch are $99.315 and $99.16, with relatively clear bearish signals.
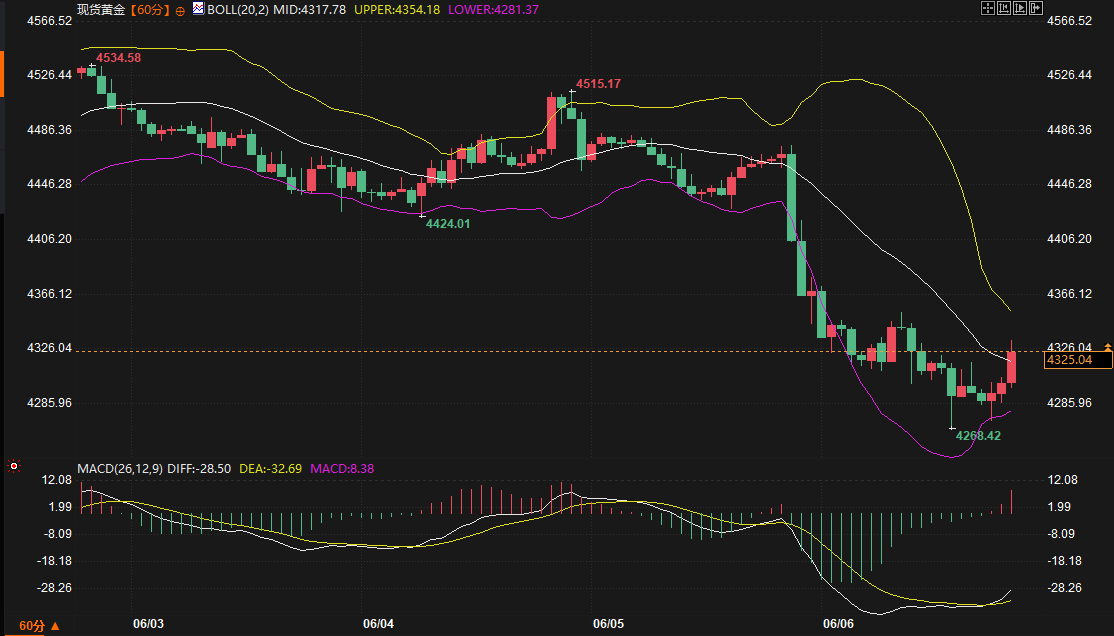
Spot gold rebounded quickly after a sharp drop to 4268.42, currently hovering around the Bollinger Middle Band at 4317.78. The MACD has formed a golden cross below the zero line, with the red bars expanding, indicating some accumulation of rebound momentum. Key resistance lies near the upper Bollinger Band at 4354, with further upward movement potentially challenging the 4424 area. Key support levels are the middle Bollinger Band at 4317 and the lower Bollinger Band at 4281; a break below 4268 would test the rebound structure.
The negative correlation between the US dollar, US Treasury yields, and gold has been confirmed again in this round of market movements. When employment data pushes up interest rate expectations, the dollar and yields strengthen in tandem, putting significant pressure on gold. Meanwhile, oil price fluctuations indirectly affect Federal Reserve policy expectations through the inflation path, forming a second layer of transmission. Data shows that on June 6th, all three assets (yields, crude oil, and the US dollar) surged and then retreated, with technical signals simultaneously indicating weakening bullish momentum. Short-term downward pressure from this convergence warrants attention. As a safe-haven asset, gold receives some support when geopolitical factors escalate, but its upside potential is limited in a strong dollar and high-interest-rate environment, exhibiting typical cross-market correlation characteristics.
In the short term, the market remains in a data- and news-driven consolidation phase. Whether gold can hold above the middle Bollinger Band and break through 4354 will determine the strength of short-term bullish momentum; if US crude oil falls below the 89-90 area, it may further test lower support levels; the US dollar and yields will depend on the correction in interest rate hike expectations based on this week's CPI data. Logically, if the data continues to be strong, interest rate assets will remain relatively strong, and gold will face a test; if geopolitical risks ease, the pressure for a price correction in oil may increase.
From a medium- to long-term perspective, the resilience of the job market and the path of inflation remain key variables. The pace of Federal Reserve policy will dominate the direction of the US dollar and US Treasury yields, while gold may continue to face structural pressure in a high-interest-rate environment. However, as a diversified asset, its long-term attributes are still worth discussing. The overall trend will revolve around the verification of fundamental data and the breakout of technical ranges, requiring continuous monitoring of signals released by subsequent economic indicators.
Whether the current gold rebound can be sustained depends on which key signals to watch.
Data shows that gold has rebounded from a low of 4268 to near the middle Bollinger Band, with the MACD golden cross below the zero line providing some technical support. However, fundamentals remain suppressed by employment data and expectations of interest rate hikes. If this week's CPI data does not exceed expectations, and the price can effectively stabilize in the 4317-4325 range accompanied by increased trading volume, the rebound may continue to challenge the 4354 resistance level. Conversely, if the middle Bollinger Band is breached again, the rebound may turn into a phase of correction.
Is the short-term trend of US crude oil driven by geopolitical factors or supply and demand fundamentals?
Current oil price fluctuations are primarily driven by news, with prices rising in the morning due to related news but then falling back. Technically, prices have broken below the middle Bollinger Band, and a MACD death cross is emerging. The 89-90 area below forms a significant support zone. If geopolitical tensions ease, supply and demand fundamentals will regain dominance, and prices may return to range-bound trading. It is necessary to pay attention to how actual supply changes will affect expectations.
Does the decline in the US dollar index signify a trend reversal?
The US dollar index rose sharply on June 6th before falling back and breaking below the lower Bollinger Band, with a MACD death cross forming, indicating a strong short-term bearish signal. However, this is largely a result of profit-taking and post-data adjustments. In the medium term, the Fed's policy path remains crucial; if rate hike expectations continue to materialize, the dollar will still have support. Key levels to watch are 99.3 and 99.16; a break below these levels would strengthen the pullback.
How is the negative correlation between US Treasury yields and gold manifested in this round?
Gold rebounded as the 2-year US Treasury yield tested the 4.149% support level, demonstrating a certain negative correlation. Rising yields increase the cost of holding gold, a relationship that is relatively clear given the data-driven nature of the market. In the short term, a continued pullback in yields may provide some breathing room for gold; however, if yields resume their upward trend, gold will face greater pressure. Amid cross-market linkages, the interest rate path remains a crucial anchor for gold pricing.
How do investors view the current increase in market volatility?
The widening Bollinger Bands indicate that the increase in volatility is a temporary phenomenon, influenced by a combination of factors including employment data, geopolitical news, and policy expectations. Logically, short-term market movements are expected to be characterized by range-bound trading and data validation, without excessive amplification of single-day fluctuations. Focusing on key support and resistance levels and understanding cross-asset correlation signals will help to form a more complete market picture. This week's CPI and other data will serve as important windows for evaluating the rationality of current pricing.
Fundamental drivers and changes in policy expectations
The US added 172,000 non-farm payroll jobs in May, coupled with an upward revision of April's data, indicating that the labor market was more resilient than some market expectations. A well-known foreign media report stated that this data pushed market pricing in a December rate hike by the Federal Reserve from around 45% a week ago to over 70%. The 10-year US Treasury yield rose to a two-week high, increasing the opportunity cost of holding gold. The logic suggests that the stronger-than-expected employment data reinforces the possibility that the Federal Reserve will maintain higher interest rates for a longer period, which puts direct pressure on non-yielding assets like gold, while supporting the US dollar and US Treasury yields.
Meanwhile, new developments emerged in the Middle East situation. News of actions by Israel and Iran caused oil prices to rise sharply in early trading before falling back, reflecting a mix of inflation concerns and risk aversion. Major overseas institutions analyzed that if this week's US CPI data is strong, it will further test the support level for gold. From a fundamental perspective, employment, inflation, and geopolitical factors work together to form the core logic of current market pricing.
Technical signals and key range judgment
From a 60-minute technical perspective, all four maturities are showing a correction pattern after the surge and subsequent pullback on June 6th. The latest yield on the 2-year US Treasury note is 4.152%, breaking below the Bollinger Middle Band at 4.171 and currently testing the support level at 4.149. The MACD histogram has shortened significantly, and the DIFF and DEA lines have turned downwards, indicating weakening bullish momentum and a risk of further pullback in the short term. Resistance is expected in the 4.198 to 4.256 range.
US crude oil is currently trading at $91.28, having broken below the Bollinger Middle Band at $92.64. Support levels are at the lower Bollinger Band at $89.03 and the previous low of $89.68. The MACD histogram is shortening and approaching a death cross, indicating short-term bearish pressure. The US Dollar Index has broken below the lower Bollinger Band at $99.9343, and the MACD has formed a death cross. Support levels to watch are $99.315 and $99.16, with relatively clear bearish signals.
Spot gold rebounded quickly after a sharp drop to 4268.42, currently hovering around the Bollinger Middle Band at 4317.78. The MACD has formed a golden cross below the zero line, with the red bars expanding, indicating some accumulation of rebound momentum. Key resistance lies near the upper Bollinger Band at 4354, with further upward movement potentially challenging the 4424 area. Key support levels are the middle Bollinger Band at 4317 and the lower Bollinger Band at 4281; a break below 4268 would test the rebound structure.
Cross-market linkage effect analysis
The negative correlation between the US dollar, US Treasury yields, and gold has been confirmed again in this round of market movements. When employment data pushes up interest rate expectations, the dollar and yields strengthen in tandem, putting significant pressure on gold. Meanwhile, oil price fluctuations indirectly affect Federal Reserve policy expectations through the inflation path, forming a second layer of transmission. Data shows that on June 6th, all three assets (yields, crude oil, and the US dollar) surged and then retreated, with technical signals simultaneously indicating weakening bullish momentum. Short-term downward pressure from this convergence warrants attention. As a safe-haven asset, gold receives some support when geopolitical factors escalate, but its upside potential is limited in a strong dollar and high-interest-rate environment, exhibiting typical cross-market correlation characteristics.
Trend Outlook
In the short term, the market remains in a data- and news-driven consolidation phase. Whether gold can hold above the middle Bollinger Band and break through 4354 will determine the strength of short-term bullish momentum; if US crude oil falls below the 89-90 area, it may further test lower support levels; the US dollar and yields will depend on the correction in interest rate hike expectations based on this week's CPI data. Logically, if the data continues to be strong, interest rate assets will remain relatively strong, and gold will face a test; if geopolitical risks ease, the pressure for a price correction in oil may increase.
From a medium- to long-term perspective, the resilience of the job market and the path of inflation remain key variables. The pace of Federal Reserve policy will dominate the direction of the US dollar and US Treasury yields, while gold may continue to face structural pressure in a high-interest-rate environment. However, as a diversified asset, its long-term attributes are still worth discussing. The overall trend will revolve around the verification of fundamental data and the breakout of technical ranges, requiring continuous monitoring of signals released by subsequent economic indicators.
Frequently Asked Questions
Whether the current gold rebound can be sustained depends on which key signals to watch.
Data shows that gold has rebounded from a low of 4268 to near the middle Bollinger Band, with the MACD golden cross below the zero line providing some technical support. However, fundamentals remain suppressed by employment data and expectations of interest rate hikes. If this week's CPI data does not exceed expectations, and the price can effectively stabilize in the 4317-4325 range accompanied by increased trading volume, the rebound may continue to challenge the 4354 resistance level. Conversely, if the middle Bollinger Band is breached again, the rebound may turn into a phase of correction.
Is the short-term trend of US crude oil driven by geopolitical factors or supply and demand fundamentals?
Current oil price fluctuations are primarily driven by news, with prices rising in the morning due to related news but then falling back. Technically, prices have broken below the middle Bollinger Band, and a MACD death cross is emerging. The 89-90 area below forms a significant support zone. If geopolitical tensions ease, supply and demand fundamentals will regain dominance, and prices may return to range-bound trading. It is necessary to pay attention to how actual supply changes will affect expectations.
Does the decline in the US dollar index signify a trend reversal?
The US dollar index rose sharply on June 6th before falling back and breaking below the lower Bollinger Band, with a MACD death cross forming, indicating a strong short-term bearish signal. However, this is largely a result of profit-taking and post-data adjustments. In the medium term, the Fed's policy path remains crucial; if rate hike expectations continue to materialize, the dollar will still have support. Key levels to watch are 99.3 and 99.16; a break below these levels would strengthen the pullback.
How is the negative correlation between US Treasury yields and gold manifested in this round?
Gold rebounded as the 2-year US Treasury yield tested the 4.149% support level, demonstrating a certain negative correlation. Rising yields increase the cost of holding gold, a relationship that is relatively clear given the data-driven nature of the market. In the short term, a continued pullback in yields may provide some breathing room for gold; however, if yields resume their upward trend, gold will face greater pressure. Amid cross-market linkages, the interest rate path remains a crucial anchor for gold pricing.
How do investors view the current increase in market volatility?
The widening Bollinger Bands indicate that the increase in volatility is a temporary phenomenon, influenced by a combination of factors including employment data, geopolitical news, and policy expectations. Logically, short-term market movements are expected to be characterized by range-bound trading and data validation, without excessive amplification of single-day fluctuations. Focusing on key support and resistance levels and understanding cross-asset correlation signals will help to form a more complete market picture. This week's CPI and other data will serve as important windows for evaluating the rationality of current pricing.
- Risk Warning and Disclaimer
- The market involves risk, and trading may not be suitable for all investors. This article is for reference only and does not constitute personal investment advice, nor does it take into account certain users’ specific investment objectives, financial situation, or other needs. Any investment decisions made based on this information are at your own risk.