Is chasing the dollar now a case of buying at the breakout point or getting caught at the top of the flagpole?
2026-06-22 20:18:39
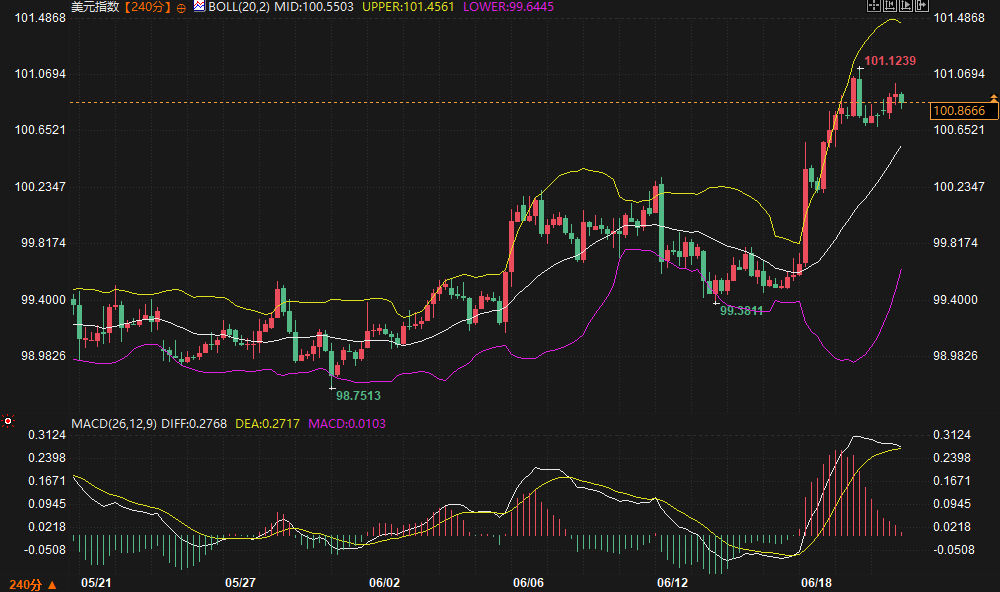
On Monday (June 22), US Treasury bonds continued their weakness from Friday, with the market entering a delicate balancing phase after digesting multiple pieces of information. Latest quotes show the US dollar index trading around 100.87, between the middle and upper Bollinger Bands on the 240-minute chart. This movement is not isolated; it's driven by a synchronized rebound in both short- and long-term US Treasury yields. The 2-year Treasury yield hit a new high of 4.229%, while the 10-year yield rose to 4.492%. The market reveals a clear logic: core inflation stickiness and geopolitical premiums are jointly reshaping the Federal Reserve's policy expectations, and these expectations directly support the dollar through interest rate differentials.
The market is currently cautiously assessing the subsequent impact of the Persian Gulf situation. Although the US and Iran have reached some mechanism aimed at easing the conflict, the risk premium associated with passage through the Strait of Hormuz has not completely subsided. Oil prices are consolidating at high levels above $75, reinforcing market concerns about energy costs pushing up inflation. This concern is particularly evident in the short-term Treasury market, with the 2-year yield extremely sensitive to a hawkish shift in the Federal Reserve. A recent report from a well-known institution points out that the Fed Chair emphasized price stability in his first press conference, and the dot plot shifted to a more hawkish median, suggesting that there may still be room for tightening this year. This narrative constitutes the core driver of the recent dollar rebound, but whether the rebound can continue depends on the upcoming resistance level.
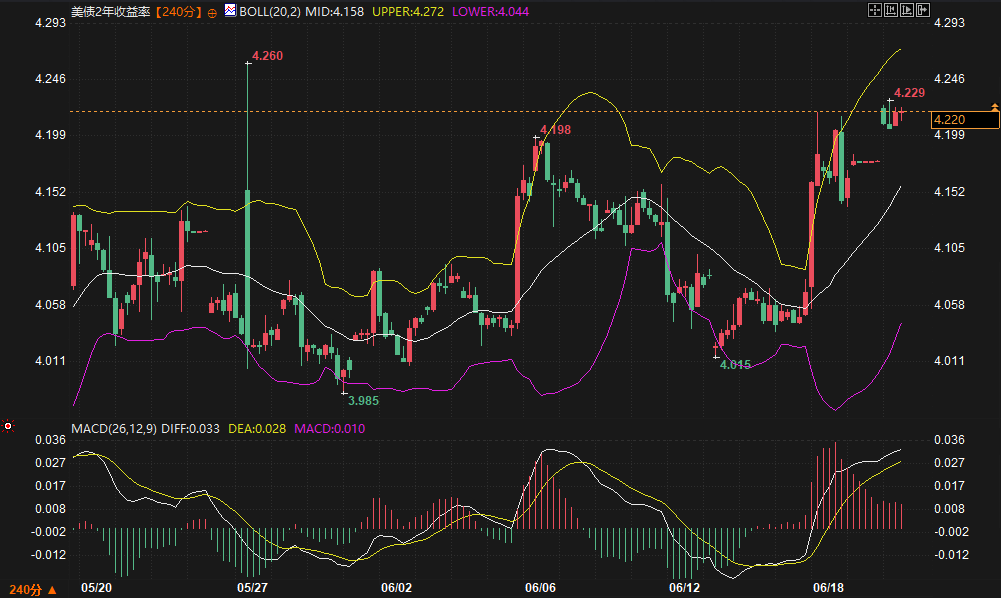
A close examination of the term structure of US Treasury yields reveals the core of the market's contradictions. In this rebound, the 2-year Treasury yield has seen the most significant rise, climbing from a low of 3.985% to 4.229%, approaching the upper Bollinger Band at 4.272%. Momentum indicators show the MACD lines maintaining a positive divergence above the zero line, indicating that short-term interest rate expectations remain hawkish. This directly reflects the market's pricing in the possibility that the Federal Reserve may restart interest rate hikes due to rising oil prices and core inflation. Currently, while the market's implied rate hike expectation is less than 45 basis points, a major global research institution has already adjusted its forecast to three 25-basis-point rate hikes in 2026.
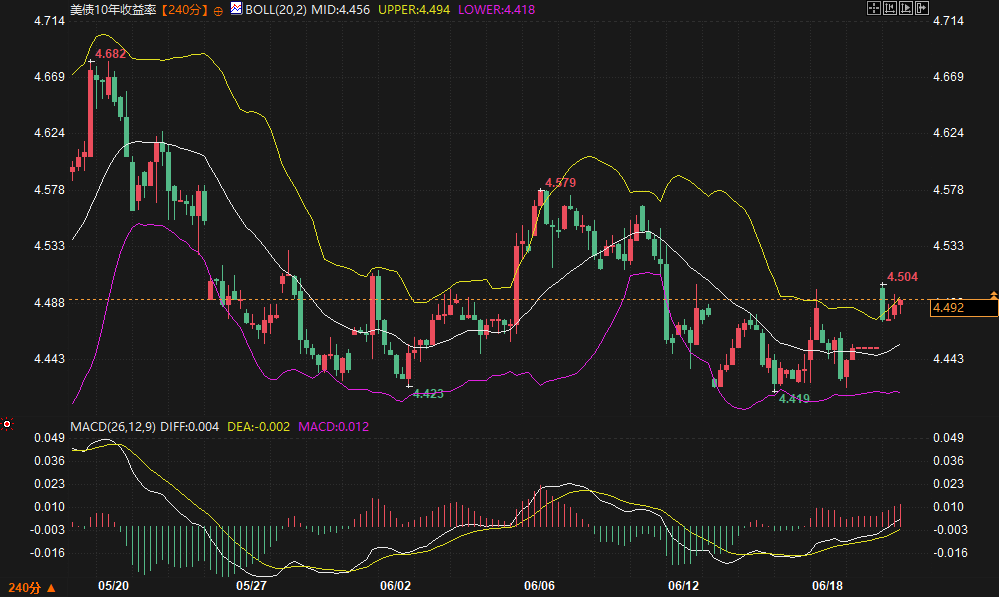
In contrast, the rebound in the 10-year US Treasury yield appears restrained and more technically significant. After falling to 4.419%, the yield rebounded slightly to 4.494%, with the Bollinger Bands narrowing drastically to a mere 7.6 basis points. This pattern is a typical precursor to a market reversal . The MACD has just formed a golden cross below the zero line, giving a short-term bullish signal, but the strength of this bullishness needs confirmation as the two lines remain constrained by the zero line. The inverted spread between the 2-year and 10-year yields has narrowed to around 26 basis points, indicating that the market believes the risk of recession is diminishing, but also implying concerns about runaway long-term inflation. For the US dollar index to continue its upward trend and break through the upper resistance level of 101.46, a decisive break above 4.50% in the 10-year yield is needed, driving up real interest rates.
Mapping macroeconomic policies onto the technical chart of the US dollar index reveals several key support and resistance levels :
1. Immediate Resistance Zone (101.12 - 101.46) : The reference contract is the US Dollar Index spot. 101.12 is the previous high, and 101.46 is the upper Bollinger Band on the 240-minute chart. If the long-term yield of US Treasury bonds cannot break through effectively, signs of weakening bullish momentum in the US dollar will be amplified in this range.
2. Key Support Zone (100.55 - 100.65) : This is the intersection of the current Bollinger Band middle line and the short-term high-volume trading area. If Federal Reserve officials release reassuring signals in their speeches today, or if oil prices experience a significant pullback, the US dollar index will likely retrace to this area.
3. Key Focus During Trading : While there is a lack of major economic data today, the market will closely watch comments from Federal Reserve officials after the blackout period. Any statements questioning the current hawkish pricing could trigger short covering of dollar bulls. Meanwhile, the 2-year Treasury yield faces technical selling pressure above 4.27%; if this breakout fails and the yield falls back, a corresponding pullback in the dollar is likely unavoidable.
The current market is transitioning from short-term sentiment-driven to fundamental validation. A well-known institution analyzes that if the market fully prices in three rate hikes, the risk-reward ratio of front-end Treasury bonds will become attractive, as expectations may have already outpaced the Fed's moves. Technically, this corresponds to strong resistance around 4.27% for the 2-year yield. Considering the near exhaustion of the MACD histogram for the US dollar index, the cost-effectiveness of chasing high levels is decreasing. If oil prices can stabilize their decline, and demand for US Treasury auctions this week is acceptable, yields and the dollar may experience a brief period of converging adjustment. If the 10-year US Treasury yield breaks above 4.50%, the dollar still has the momentum to launch a second attack on 101.46, but the sustainability of this breakout depends on further escalation of geopolitical tensions or actual support from core inflation data.
What are the main drivers behind the current rebound in the US dollar index?
The core driver was the broad-based rebound in US Treasury yields, particularly the continued rise in the policy-sensitive 2-year Treasury yield. Due to persistently high core inflation and energy premiums stemming from the Persian Gulf situation, the market is repricing the probability of a Fed rate hike in 2026, shifting from a previous wait-and-see attitude to betting on potential further tightening. This interest rate differential provided direct support for the US dollar.
Why is the difference in volatility between 2-year and 10-year US Treasury yields worth paying special attention to?
The difference between the two reflects differing market views on short-term policy tightening and long-term economic growth. The surge in the 2-year yield directly reflects concerns about interest rate hikes, while the moderate rebound in the 10-year yield and the extremely narrowing Bollinger Bands indicate that the market is at a turning point. If the 10-year yield fails to break through key resistance, it suggests that market concerns about prolonged high interest rates damaging the economy persist, which would limit the dollar's upside potential.
How does the situation in the Persian Gulf transmit to the US dollar index through US Treasury bonds?
Uncertainty surrounding the situation has driven up international oil prices, directly exacerbating market fears of rising inflation. Rising inflation expectations erode the value of fixed-income assets, leading investors to sell US Treasuries and push up yields. Higher US Treasury yields, especially at the front end, enhance the dollar's interest rate advantage, thereby driving capital inflows into dollar assets.
What are the biggest risks to the US dollar index and the 10-year US Treasury yield according to technical analysis?
The risk to the US dollar index lies in the fact that although the current rebound has reached the middle Bollinger Band, the MACD bullish momentum histogram is only 0.0103, indicating that the upward momentum is weakening and there is a risk of a pullback from the high level. Meanwhile, the Bollinger Band width of the 10-year US Treasury yield has narrowed drastically, suggesting a directional breakout in the short term. If it fails to break upwards and instead turns downwards, it will lead to a simultaneous weakening of the US dollar.
The article mentions that the Fed's dot plot has turned hawkish. What implications does this have for ordinary investors observing the market?
The shift in the dot plot suggests that the Federal Reserve internally views a rate hike as more likely than a rate cut. This alters the market's "reaction function": future economic data, particularly higher-than-expected inflation, will trigger more significant market volatility and panic pricing in tighter monetary policy. Investors should reduce their bets on a single data-driven direction and pay closer attention to real-time speeches by Fed officials to gauge their tolerance for improved data in the current high-interest-rate environment.
The market is currently cautiously assessing the subsequent impact of the Persian Gulf situation. Although the US and Iran have reached some mechanism aimed at easing the conflict, the risk premium associated with passage through the Strait of Hormuz has not completely subsided. Oil prices are consolidating at high levels above $75, reinforcing market concerns about energy costs pushing up inflation. This concern is particularly evident in the short-term Treasury market, with the 2-year yield extremely sensitive to a hawkish shift in the Federal Reserve. A recent report from a well-known institution points out that the Fed Chair emphasized price stability in his first press conference, and the dot plot shifted to a more hawkish median, suggesting that there may still be room for tightening this year. This narrative constitutes the core driver of the recent dollar rebound, but whether the rebound can continue depends on the upcoming resistance level.
A deep dive into the US Treasury term structure reveals a clash between technical resistance and policy expectations.
A close examination of the term structure of US Treasury yields reveals the core of the market's contradictions. In this rebound, the 2-year Treasury yield has seen the most significant rise, climbing from a low of 3.985% to 4.229%, approaching the upper Bollinger Band at 4.272%. Momentum indicators show the MACD lines maintaining a positive divergence above the zero line, indicating that short-term interest rate expectations remain hawkish. This directly reflects the market's pricing in the possibility that the Federal Reserve may restart interest rate hikes due to rising oil prices and core inflation. Currently, while the market's implied rate hike expectation is less than 45 basis points, a major global research institution has already adjusted its forecast to three 25-basis-point rate hikes in 2026.
In contrast, the rebound in the 10-year US Treasury yield appears restrained and more technically significant. After falling to 4.419%, the yield rebounded slightly to 4.494%, with the Bollinger Bands narrowing drastically to a mere 7.6 basis points. This pattern is a typical precursor to a market reversal . The MACD has just formed a golden cross below the zero line, giving a short-term bullish signal, but the strength of this bullishness needs confirmation as the two lines remain constrained by the zero line. The inverted spread between the 2-year and 10-year yields has narrowed to around 26 basis points, indicating that the market believes the risk of recession is diminishing, but also implying concerns about runaway long-term inflation. For the US dollar index to continue its upward trend and break through the upper resistance level of 101.46, a decisive break above 4.50% in the 10-year yield is needed, driving up real interest rates.
Mapping macroeconomic policies onto the technical chart of the US dollar index reveals several key support and resistance levels :
1. Immediate Resistance Zone (101.12 - 101.46) : The reference contract is the US Dollar Index spot. 101.12 is the previous high, and 101.46 is the upper Bollinger Band on the 240-minute chart. If the long-term yield of US Treasury bonds cannot break through effectively, signs of weakening bullish momentum in the US dollar will be amplified in this range.
2. Key Support Zone (100.55 - 100.65) : This is the intersection of the current Bollinger Band middle line and the short-term high-volume trading area. If Federal Reserve officials release reassuring signals in their speeches today, or if oil prices experience a significant pullback, the US dollar index will likely retrace to this area.
3. Key Focus During Trading : While there is a lack of major economic data today, the market will closely watch comments from Federal Reserve officials after the blackout period. Any statements questioning the current hawkish pricing could trigger short covering of dollar bulls. Meanwhile, the 2-year Treasury yield faces technical selling pressure above 4.27%; if this breakout fails and the yield falls back, a corresponding pullback in the dollar is likely unavoidable.
The directional decision following volatility convergence: a market path deduction after digesting short-term sentiment.
The current market is transitioning from short-term sentiment-driven to fundamental validation. A well-known institution analyzes that if the market fully prices in three rate hikes, the risk-reward ratio of front-end Treasury bonds will become attractive, as expectations may have already outpaced the Fed's moves. Technically, this corresponds to strong resistance around 4.27% for the 2-year yield. Considering the near exhaustion of the MACD histogram for the US dollar index, the cost-effectiveness of chasing high levels is decreasing. If oil prices can stabilize their decline, and demand for US Treasury auctions this week is acceptable, yields and the dollar may experience a brief period of converging adjustment. If the 10-year US Treasury yield breaks above 4.50%, the dollar still has the momentum to launch a second attack on 101.46, but the sustainability of this breakout depends on further escalation of geopolitical tensions or actual support from core inflation data.
Frequently Asked Questions
What are the main drivers behind the current rebound in the US dollar index?
The core driver was the broad-based rebound in US Treasury yields, particularly the continued rise in the policy-sensitive 2-year Treasury yield. Due to persistently high core inflation and energy premiums stemming from the Persian Gulf situation, the market is repricing the probability of a Fed rate hike in 2026, shifting from a previous wait-and-see attitude to betting on potential further tightening. This interest rate differential provided direct support for the US dollar.
Why is the difference in volatility between 2-year and 10-year US Treasury yields worth paying special attention to?
The difference between the two reflects differing market views on short-term policy tightening and long-term economic growth. The surge in the 2-year yield directly reflects concerns about interest rate hikes, while the moderate rebound in the 10-year yield and the extremely narrowing Bollinger Bands indicate that the market is at a turning point. If the 10-year yield fails to break through key resistance, it suggests that market concerns about prolonged high interest rates damaging the economy persist, which would limit the dollar's upside potential.
How does the situation in the Persian Gulf transmit to the US dollar index through US Treasury bonds?
Uncertainty surrounding the situation has driven up international oil prices, directly exacerbating market fears of rising inflation. Rising inflation expectations erode the value of fixed-income assets, leading investors to sell US Treasuries and push up yields. Higher US Treasury yields, especially at the front end, enhance the dollar's interest rate advantage, thereby driving capital inflows into dollar assets.
What are the biggest risks to the US dollar index and the 10-year US Treasury yield according to technical analysis?
The risk to the US dollar index lies in the fact that although the current rebound has reached the middle Bollinger Band, the MACD bullish momentum histogram is only 0.0103, indicating that the upward momentum is weakening and there is a risk of a pullback from the high level. Meanwhile, the Bollinger Band width of the 10-year US Treasury yield has narrowed drastically, suggesting a directional breakout in the short term. If it fails to break upwards and instead turns downwards, it will lead to a simultaneous weakening of the US dollar.
The article mentions that the Fed's dot plot has turned hawkish. What implications does this have for ordinary investors observing the market?
The shift in the dot plot suggests that the Federal Reserve internally views a rate hike as more likely than a rate cut. This alters the market's "reaction function": future economic data, particularly higher-than-expected inflation, will trigger more significant market volatility and panic pricing in tighter monetary policy. Investors should reduce their bets on a single data-driven direction and pay closer attention to real-time speeches by Fed officials to gauge their tolerance for improved data in the current high-interest-rate environment.
- Risk Warning and Disclaimer
- The market involves risk, and trading may not be suitable for all investors. This article is for reference only and does not constitute personal investment advice, nor does it take into account certain users’ specific investment objectives, financial situation, or other needs. Any investment decisions made based on this information are at your own risk.