Silver Price Forecast: Spot silver remains trapped in a downward channel.
2026-07-10 00:24:56
On Thursday (July 9), during the US trading session, silver ended its three-day losing streak, benefiting from a slight pullback in the US dollar and a decline in US Treasury yields. At the time of writing, spot silver was trading around $60.30, with a daily gain of 3.38%.
Despite a rebound during the day, the overall trend for spot silver remains bearish. Since mid-May, silver has seen lower highs and lower lows; the current price is below key moving averages and has fallen by nearly half from its historical high of approximately $121 reached in January of this year.
Unfavorable macroeconomic factors are suppressing silver prices, making it difficult for silver to initiate a sustained upward trend. The renewed escalation of conflict in the Middle East has raised market concerns about rising energy prices pushing up inflation, thus reinforcing the market view that the Federal Reserve may continue to raise interest rates.
Silver itself does not generate interest income. As borrowing costs rise, silver becomes less attractive compared to interest-bearing assets, putting downward pressure on its price.
The Federal Reserve's hawkish stance, coupled with geopolitical tensions, limited the downside potential for the dollar. The dollar index (DXY), which measures the dollar against six major currencies, fell to a low of 100.79 during the day before recovering to around 100.94.
Technical Analysis
The daily chart shows that the short-term trend for spot silver is bearish, with the price trading within a downward parallel channel and below the 200-day simple moving average at $70.25 and the 100-day simple moving average at $74.32.
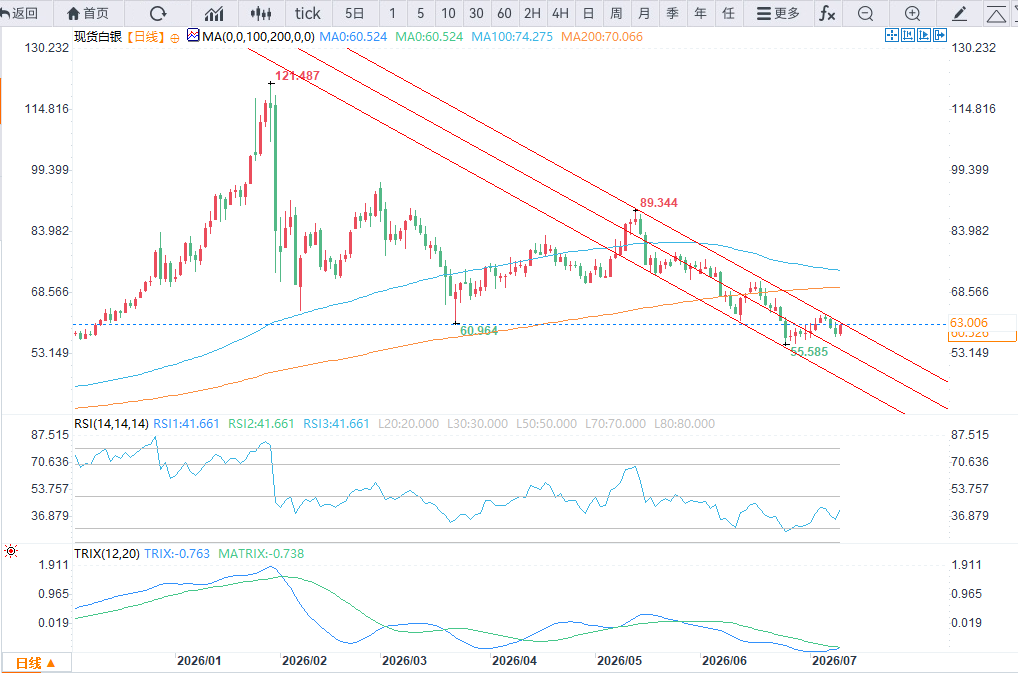
(Spot silver daily chart source: EasyTrade)
The current silver price is just a step away from the upper channel line at $63.50, meaning that short-term gains will be constrained; the Relative Strength Index (RSI) is around 41, reflecting weak upward momentum. Although the MACD (Moving Average Convergence Divergence) has turned positive, this only represents a small rebound within the overall downward correction trend.
upper resistance level
The primary resistance level is the upper channel line at $63.50. Only if the price firmly breaks through this level will silver have a chance to challenge the 200-day moving average at $70.25 and the 100-day moving average at $74.32.
support level below
The first support level is at $55; if the bears regain the upper hand, the lower edge of the channel at $45 will be a key support zone with stronger buying pressure.
Despite a rebound during the day, the overall trend for spot silver remains bearish. Since mid-May, silver has seen lower highs and lower lows; the current price is below key moving averages and has fallen by nearly half from its historical high of approximately $121 reached in January of this year.
Unfavorable macroeconomic factors are suppressing silver prices, making it difficult for silver to initiate a sustained upward trend. The renewed escalation of conflict in the Middle East has raised market concerns about rising energy prices pushing up inflation, thus reinforcing the market view that the Federal Reserve may continue to raise interest rates.
Silver itself does not generate interest income. As borrowing costs rise, silver becomes less attractive compared to interest-bearing assets, putting downward pressure on its price.
The Federal Reserve's hawkish stance, coupled with geopolitical tensions, limited the downside potential for the dollar. The dollar index (DXY), which measures the dollar against six major currencies, fell to a low of 100.79 during the day before recovering to around 100.94.
Technical Analysis
The daily chart shows that the short-term trend for spot silver is bearish, with the price trading within a downward parallel channel and below the 200-day simple moving average at $70.25 and the 100-day simple moving average at $74.32.
(Spot silver daily chart source: EasyTrade)
The current silver price is just a step away from the upper channel line at $63.50, meaning that short-term gains will be constrained; the Relative Strength Index (RSI) is around 41, reflecting weak upward momentum. Although the MACD (Moving Average Convergence Divergence) has turned positive, this only represents a small rebound within the overall downward correction trend.
upper resistance level
The primary resistance level is the upper channel line at $63.50. Only if the price firmly breaks through this level will silver have a chance to challenge the 200-day moving average at $70.25 and the 100-day moving average at $74.32.
support level below
The first support level is at $55; if the bears regain the upper hand, the lower edge of the channel at $45 will be a key support zone with stronger buying pressure.
- Risk Warning and Disclaimer
- The market involves risk, and trading may not be suitable for all investors. This article is for reference only and does not constitute personal investment advice, nor does it take into account certain users’ specific investment objectives, financial situation, or other needs. Any investment decisions made based on this information are at your own risk.