The oil situation in the Strait of Hormuz pushed up US Treasury yields, causing gold and silver prices to decline.
2026-07-13 22:00:11
On Monday (July 13), spot gold and spot silver fell sharply during the US trading session. The renewed escalation of the conflict between the US and Iran in the Strait of Hormuz pushed up oil prices, leading to higher US Treasury yields. Market concerns arose that energy inflation might force the Federal Reserve to maintain a tight monetary policy for an extended period. Spot gold fell to $4055.40 per ounce, a daily drop of 1.55%; spot silver was quoted at $58.36, down 2.35%.  Following the release of June's employment data last Thursday and the Federal Reserve meeting minutes on Wednesday, the positive impact of market positioning on gold is far less than it was immediately after the non-farm payroll data release. June's non-farm payrolls increased by only 57,000, with the unemployment rate remaining at 4.2%; the cumulative non-farm payrolls for April and May were revised downwards by 74,000. This employment data initially weakened market expectations for further Fed rate hikes. However, the Fed meeting minutes brought inflation risks back into the public eye, and Monday's surge in oil prices further solidified this assessment. At 7:17 AM Eastern Time, the 10-year US Treasury yield rose to around 4.582%, and the 2-year US Treasury yield broke through 4.20%; market pricing indicated a roughly 68% probability of a Fed rate hike in September. The employment data provided a floor for gold prices, but rising inflation and rising US Treasury yields constrained investors from further increasing their long positions in gold. The current situation in the Strait of Hormuz can be summarized as follows: while shipping remains open, the ongoing military standoff between the two sides makes the shipping environment unstable, and the strait has not been completely blocked. Following a series of attacks over the weekend, both the US and Iran claimed control of the Strait of Hormuz. The US stated it would uphold freedom of navigation, while Iran claimed the right to control ship passage and even charge fees to passing vessels. The number of oil tankers passing through dropped sharply. Iran's declaration of closing the Strait, followed by a new round of US strikes against Iranian targets, sent oil prices soaring. Geopolitical conflict should have been beneficial for gold, but macroeconomic factors offset safe-haven buying: rising oil prices exacerbated inflationary concerns, US Treasury yields remained high, and the US dollar strengthened. Looking at the overall market: stronger crude oil prices put downward pressure on bonds, weaker US stocks led to a sell-off in precious metals. Traders will now focus on this week's CPI inflation data, Federal Reserve Governor Kevin Warsh's congressional testimony, and whether shipping through the Strait of Hormuz will be further disrupted. If the CPI data falls short of expectations and real yields decline, gold may have a chance to return to the $4091-$4107 resistance zone; if oil prices surge again, the market will continue to focus on inflation and the Federal Reserve's subsequent policy moves. Global Market Overview: New York WTI crude oil rose sharply to $72.90 per barrel; Brent crude oil was around $79.60 per barrel; the US dollar index strengthened; the benchmark 10-year US Treasury yield hovered around 4.58%. Gold Technical Analysis
 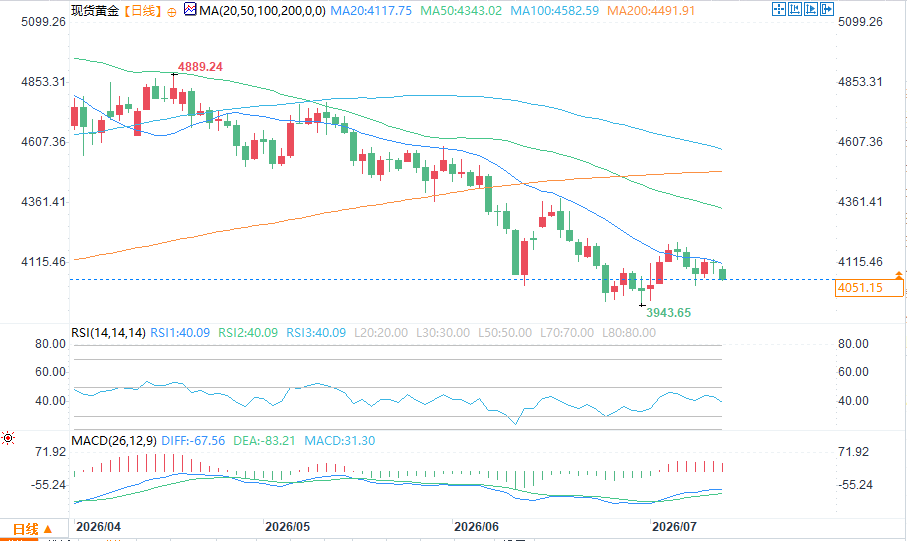 (Spot Gold Daily Chart Source: EasyTrade) Gold prices are trading below the 50-period exponential moving average ($4107), with bears holding the upper hand in the short term. Gold is currently testing the breakout range of a symmetrical triangle pattern. Bullish targets: Gold prices stabilize above $4091; continued upward movement targets $4107, with a further target of $4140. Bearish targets: A break below $4000 targets deeper at $3959, followed by $3942. First resistance level: $4091; second resistance level: $4107; first support level: $4000, followed by $3959. Silver Technical Analysis Silver prices are below the resistance level of $61.71 and the 50-period moving average of $62.81, with bears holding the upper hand in the short term. Silver bullish targets: Prices rise above $59.36, breaking through to $61.71, then targeting $62.81. Bearish target: A break below $58 would target $57, with a further drop to $55.60. First resistance is at $59.36, followed by $61.71; first support is at $58, followed by $57.
Following the release of June's employment data last Thursday and the Federal Reserve meeting minutes on Wednesday, the positive impact of market positioning on gold is far less than it was immediately after the non-farm payroll data release. June's non-farm payrolls increased by only 57,000, with the unemployment rate remaining at 4.2%; the cumulative non-farm payrolls for April and May were revised downwards by 74,000. This employment data initially weakened market expectations for further Fed rate hikes. However, the Fed meeting minutes brought inflation risks back into the public eye, and Monday's surge in oil prices further solidified this assessment. At 7:17 AM Eastern Time, the 10-year US Treasury yield rose to around 4.582%, and the 2-year US Treasury yield broke through 4.20%; market pricing indicated a roughly 68% probability of a Fed rate hike in September. The employment data provided a floor for gold prices, but rising inflation and rising US Treasury yields constrained investors from further increasing their long positions in gold. The current situation in the Strait of Hormuz can be summarized as follows: while shipping remains open, the ongoing military standoff between the two sides makes the shipping environment unstable, and the strait has not been completely blocked. Following a series of attacks over the weekend, both the US and Iran claimed control of the Strait of Hormuz. The US stated it would uphold freedom of navigation, while Iran claimed the right to control ship passage and even charge fees to passing vessels. The number of oil tankers passing through dropped sharply. Iran's declaration of closing the Strait, followed by a new round of US strikes against Iranian targets, sent oil prices soaring. Geopolitical conflict should have been beneficial for gold, but macroeconomic factors offset safe-haven buying: rising oil prices exacerbated inflationary concerns, US Treasury yields remained high, and the US dollar strengthened. Looking at the overall market: stronger crude oil prices put downward pressure on bonds, weaker US stocks led to a sell-off in precious metals. Traders will now focus on this week's CPI inflation data, Federal Reserve Governor Kevin Warsh's congressional testimony, and whether shipping through the Strait of Hormuz will be further disrupted. If the CPI data falls short of expectations and real yields decline, gold may have a chance to return to the $4091-$4107 resistance zone; if oil prices surge again, the market will continue to focus on inflation and the Federal Reserve's subsequent policy moves. Global Market Overview: New York WTI crude oil rose sharply to $72.90 per barrel; Brent crude oil was around $79.60 per barrel; the US dollar index strengthened; the benchmark 10-year US Treasury yield hovered around 4.58%. Gold Technical Analysis (Spot Gold Daily Chart Source: EasyTrade) Gold prices are trading below the 50-period exponential moving average ($4107), with bears holding the upper hand in the short term. Gold is currently testing the breakout range of a symmetrical triangle pattern. Bullish targets: Gold prices stabilize above $4091; continued upward movement targets $4107, with a further target of $4140. Bearish targets: A break below $4000 targets deeper at $3959, followed by $3942. First resistance level: $4091; second resistance level: $4107; first support level: $4000, followed by $3959. Silver Technical Analysis Silver prices are below the resistance level of $61.71 and the 50-period moving average of $62.81, with bears holding the upper hand in the short term. Silver bullish targets: Prices rise above $59.36, breaking through to $61.71, then targeting $62.81. Bearish target: A break below $58 would target $57, with a further drop to $55.60. First resistance is at $59.36, followed by $61.71; first support is at $58, followed by $57.
- Risk Warning and Disclaimer
- The market involves risk, and trading may not be suitable for all investors. This article is for reference only and does not constitute personal investment advice, nor does it take into account certain users’ specific investment objectives, financial situation, or other needs. Any investment decisions made based on this information are at your own risk.