Oil prices have returned to around $79, but the market is preparing for the next round of oversupply?
2026-07-13 21:24:11
On Monday, July 13th, the crude oil market once again witnessed a typical "dual pricing" phenomenon. Gulf shipping risks pushed up near-month risk premiums, with Brent crude currently at around $79 per barrel and West Texas Intermediate (WTI) crude at around $74 per barrel, a daily increase of about 4%. However, the spot market simultaneously faced increased UAE production, the return of offshore inventories, and stronger bargaining power from Asian buyers. June North Sea crude futures briefly fell to around $68 per barrel, a drop of about $31 from the month's high, before rebounding due to escalating tensions. The market is not trading on a single shortage, but rather on the contradictory term structure of short-term channel risks and medium-term surplus expectations. The UAE reported June crude oil production of 3.8 million barrels per day to OPEC, an increase of 1.71 million barrels per day from May, representing an increase of approximately 80%. Another assessment gives a historical high of 4.1 million barrels per day, a monthly increase of approximately 900,000 barrels per day. While the two figures are consistent, they cannot be simply interpreted as a 80% increase in sustainable production capacity within a month. The base effect in May was exceptionally low due to obstructed Gulf flow, reduced production at some oil fields, and inventory accumulation. June's increase, however, encompassed oil field resumption, utilization of bypass channels, release of floating storage, and clearing of onshore inventory. Converted to a 30-day period, 1.71 million barrels per day corresponds to approximately 51.3 million barrels per month, significantly impacting regional commercial inventories and spot availability. More importantly, this increase is equivalent to 2.2 times OPEC's latest forecast for daily global demand growth in 2026. Even if only half of this increases reliably into the spot market, it will be enough to alter regional price spreads, tanker freight rates, and refinery purchasing patterns.  The disappearance of quota constraints is the second driving force. Since May 1st, the UAE has withdrawn from the production coordination framework, and previously idle spare capacity has begun to transform into export competitiveness. Energy Minister Suhail al-Mazroui previously stated that expanding capacity requires unrestricted market supply space. For traders, this means their production decisions are no longer primarily governed by internal alliance balance, but rather by cash flow, customer coverage, and market share functions. The approximately 300,000 barrels per day difference between 3.8 million barrels per day and 4.1 million barrels per day is enough to alter regional balance assessments. The former leans towards direct member reporting and crude oil caliber, while the latter may incorporate broader field assessments, condensate, or loading schedules. Production, exports, and supply to the market are not the same concept; inventory release can allow shipments to temporarily exceed actual oilfield output. Although the UAE announced its withdrawal in May, according to the organization's charter, the formal termination of membership may be postponed to the next calendar year; therefore, monthly reports still receive and aggregate its data. This institutional time lag creates the illusion that the statistics still reflect the organization's total production, while economic behavior has already broken free from quota constraints. If models fail to adjust member boundaries in a timely manner, they may underestimate the growth in supply outside the framework. Saudi Arabia reported a production of 7.122 million barrels per day (bpd) in June, an increase of 561,000 bpd from May, but only 6.637 million bpd were supplied to the market, a difference of 485,000 bpd. Another external assessment gives a production figure of 7.34 million bpd. This discrepancy may correspond to differences in storage, measurement timing, and statistical boundaries. Tracking only total production while ignoring shipments, inventories, and refinery feedstocks can easily overestimate the degree of easing in the spot market. Global oil supply rebounded by 4.1 million bpd to 98.8 million bpd in June, with Gulf oil exports increasing by 6.5 million bpd to 16.1 million bpd; offshore oil inventories increased by 117 million bpd, while onshore inventories decreased by approximately 96 million bpd. This indicates that a large amount of crude oil is being redistributed within the transportation chain and has not been entirely converted into end-consumable products. Meanwhile, while global refinery throughput increased by 1.5 million barrels per day, it was still down 6 million barrels per day year-on-year, pushing refining margins and crack spreads for some refined products to four-year highs. This has created a rare market combination: crude oil faces oversupply expectations in the long term, while refined products remain tight in the short term due to lagging refining capacity, logistics, and plant recovery. A discount in spot crude oil does not automatically equate to a comprehensive decline in energy costs; refining margins, product inventories, and regional freight rates are the key interfaces for inflation transmission. Divergent demand forecasts further amplify volatility. OPEC lowered its 2026 demand growth forecast to 780,000 barrels per day, while the International Energy Agency projects a 1 million barrel per day decrease for the year, a difference of 1.78 million barrels per day, almost equal to the increase reported by the UAE in June. Supply and demand models, by choosing different benchmarks on the demand side, will produce completely different inventory paths, inter-period spreads, and forward curves. The direct impact of increased UAE production is not an immediate depressing of all oil prices, but rather a weakening of regional pricing discipline. Saudi Arabia has significantly lowered its official selling price for August to Asia, with Arab Light crude now trading at a discount of $1.50 per barrel relative to the Oman-Dubai benchmark, indicating that competition is shifting from quota coordination to customer acquisition.
 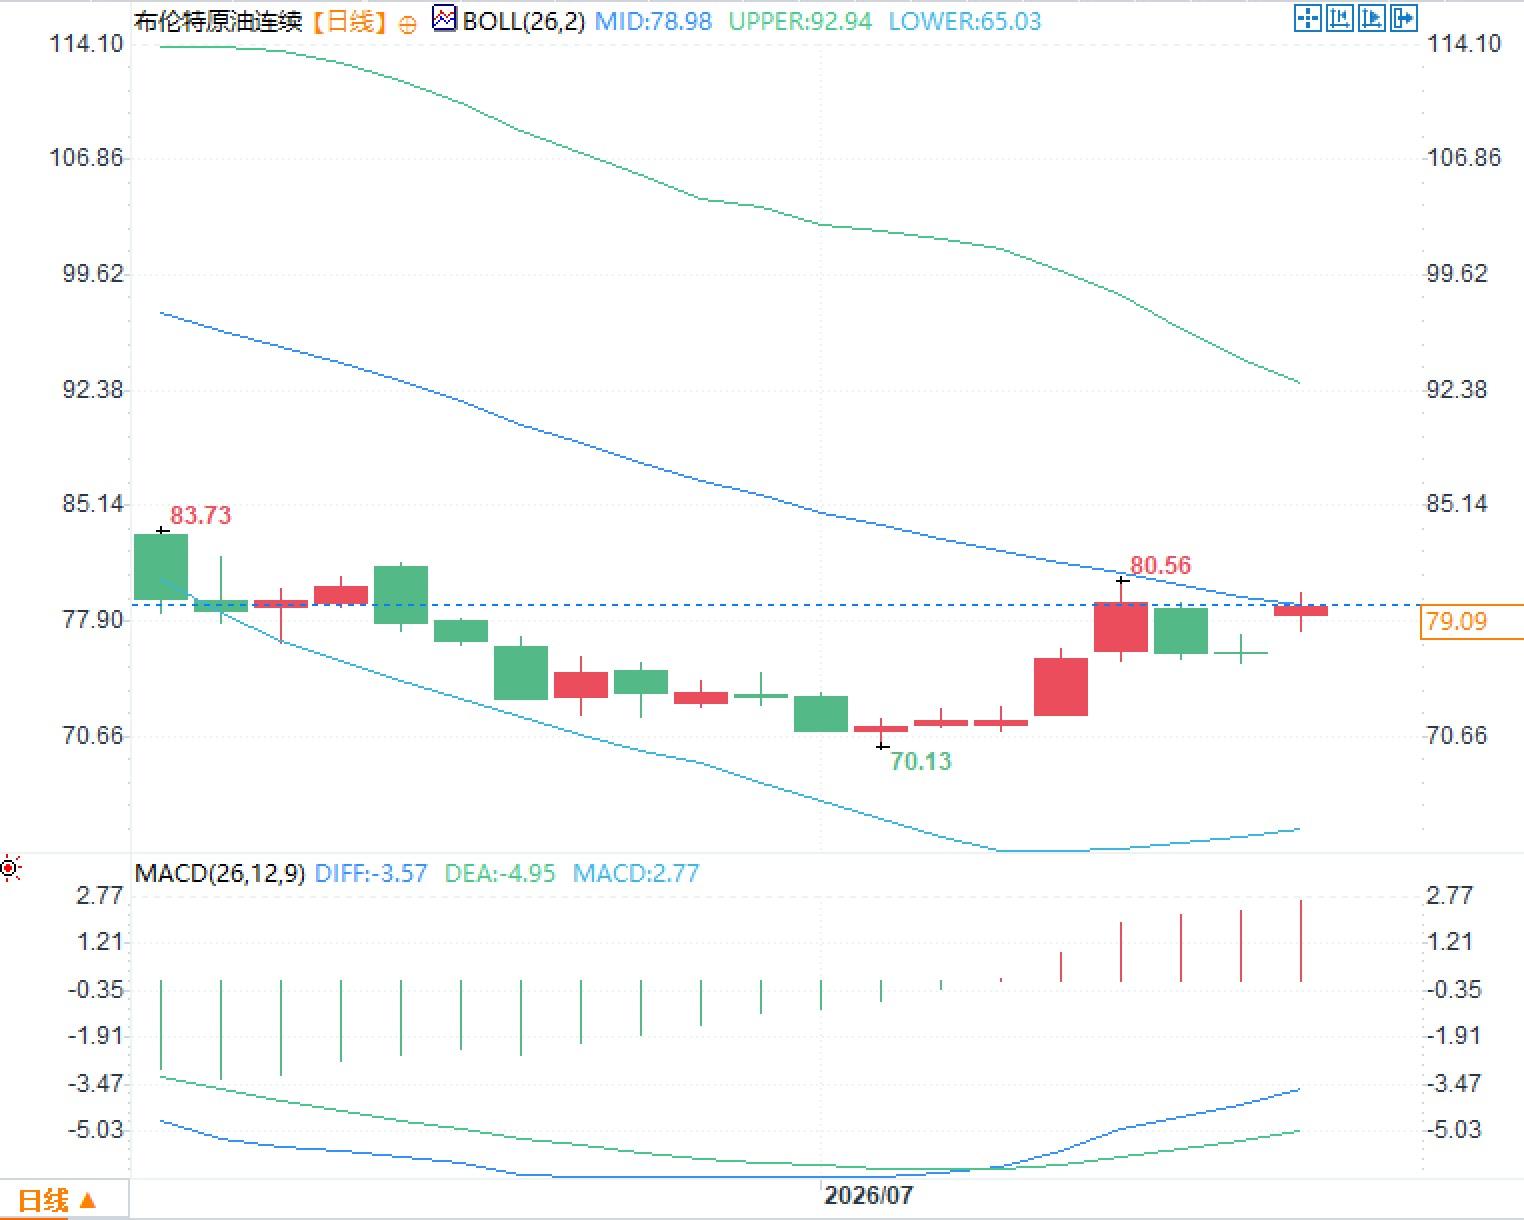 This will first transmit pressure to physical premiums and discounts, rather than absolute futures prices. Conflict news can push up Brent near-month contracts, but if medium and high-sulfur crude oils continue to trade at a discount, refineries will shift their purchases to cheaper sources, and producers will ultimately need to rebalance between price and sales volume. If near-month prices rise while far-month prices have a limited impact, it indicates that the market is buying shipping insurance; only if the entire curve rises synchronously does it represent a repricing of available inventory and sustainable production capacity. Three sets of variables need to be observed going forward: whether actual traffic volume in the Strait of Hormuz continues to recover, whether the UAE's high production can be sustained, and when maritime inventory will be converted into land-based commercial inventory. If shipping recovers while refinery restarts continue to lag, crude oil discounts and high refining margins for refined products may coexist; if conflict further compresses traffic volume, near-month risk premiums will rise rapidly, but the medium to long term will still be constrained by new supply and weak demand expectations. The current rise in oil prices reflects more channel risk than a return to a structural shortage in global supply and demand.
The disappearance of quota constraints is the second driving force. Since May 1st, the UAE has withdrawn from the production coordination framework, and previously idle spare capacity has begun to transform into export competitiveness. Energy Minister Suhail al-Mazroui previously stated that expanding capacity requires unrestricted market supply space. For traders, this means their production decisions are no longer primarily governed by internal alliance balance, but rather by cash flow, customer coverage, and market share functions. The approximately 300,000 barrels per day difference between 3.8 million barrels per day and 4.1 million barrels per day is enough to alter regional balance assessments. The former leans towards direct member reporting and crude oil caliber, while the latter may incorporate broader field assessments, condensate, or loading schedules. Production, exports, and supply to the market are not the same concept; inventory release can allow shipments to temporarily exceed actual oilfield output. Although the UAE announced its withdrawal in May, according to the organization's charter, the formal termination of membership may be postponed to the next calendar year; therefore, monthly reports still receive and aggregate its data. This institutional time lag creates the illusion that the statistics still reflect the organization's total production, while economic behavior has already broken free from quota constraints. If models fail to adjust member boundaries in a timely manner, they may underestimate the growth in supply outside the framework. Saudi Arabia reported a production of 7.122 million barrels per day (bpd) in June, an increase of 561,000 bpd from May, but only 6.637 million bpd were supplied to the market, a difference of 485,000 bpd. Another external assessment gives a production figure of 7.34 million bpd. This discrepancy may correspond to differences in storage, measurement timing, and statistical boundaries. Tracking only total production while ignoring shipments, inventories, and refinery feedstocks can easily overestimate the degree of easing in the spot market. Global oil supply rebounded by 4.1 million bpd to 98.8 million bpd in June, with Gulf oil exports increasing by 6.5 million bpd to 16.1 million bpd; offshore oil inventories increased by 117 million bpd, while onshore inventories decreased by approximately 96 million bpd. This indicates that a large amount of crude oil is being redistributed within the transportation chain and has not been entirely converted into end-consumable products. Meanwhile, while global refinery throughput increased by 1.5 million barrels per day, it was still down 6 million barrels per day year-on-year, pushing refining margins and crack spreads for some refined products to four-year highs. This has created a rare market combination: crude oil faces oversupply expectations in the long term, while refined products remain tight in the short term due to lagging refining capacity, logistics, and plant recovery. A discount in spot crude oil does not automatically equate to a comprehensive decline in energy costs; refining margins, product inventories, and regional freight rates are the key interfaces for inflation transmission. Divergent demand forecasts further amplify volatility. OPEC lowered its 2026 demand growth forecast to 780,000 barrels per day, while the International Energy Agency projects a 1 million barrel per day decrease for the year, a difference of 1.78 million barrels per day, almost equal to the increase reported by the UAE in June. Supply and demand models, by choosing different benchmarks on the demand side, will produce completely different inventory paths, inter-period spreads, and forward curves. The direct impact of increased UAE production is not an immediate depressing of all oil prices, but rather a weakening of regional pricing discipline. Saudi Arabia has significantly lowered its official selling price for August to Asia, with Arab Light crude now trading at a discount of $1.50 per barrel relative to the Oman-Dubai benchmark, indicating that competition is shifting from quota coordination to customer acquisition. This will first transmit pressure to physical premiums and discounts, rather than absolute futures prices. Conflict news can push up Brent near-month contracts, but if medium and high-sulfur crude oils continue to trade at a discount, refineries will shift their purchases to cheaper sources, and producers will ultimately need to rebalance between price and sales volume. If near-month prices rise while far-month prices have a limited impact, it indicates that the market is buying shipping insurance; only if the entire curve rises synchronously does it represent a repricing of available inventory and sustainable production capacity. Three sets of variables need to be observed going forward: whether actual traffic volume in the Strait of Hormuz continues to recover, whether the UAE's high production can be sustained, and when maritime inventory will be converted into land-based commercial inventory. If shipping recovers while refinery restarts continue to lag, crude oil discounts and high refining margins for refined products may coexist; if conflict further compresses traffic volume, near-month risk premiums will rise rapidly, but the medium to long term will still be constrained by new supply and weak demand expectations. The current rise in oil prices reflects more channel risk than a return to a structural shortage in global supply and demand.
- Risk Warning and Disclaimer
- The market involves risk, and trading may not be suitable for all investors. This article is for reference only and does not constitute personal investment advice, nor does it take into account certain users’ specific investment objectives, financial situation, or other needs. Any investment decisions made based on this information are at your own risk.