A chart showing support and resistance levels for 18 major forex pairs: USD + EUR/JPY + Commodity Currencies + Emerging Market Currencies (July 14, 2026)
2026-07-14 08:00:13
A chart showing support and resistance levels for major currency pairs: USD + EUR/JPY + Commodity Currencies + Emerging Market Currencies, updated Tuesday, July 14, 2026 at 07:50. It includes 18 major currency pairs such as USD/EUR/JPY/GBP/CHF/AUD/NZD/CAD + CNY/HKD/RUB/RANT/CHK. For more details, please see the chart specially created by FX678. 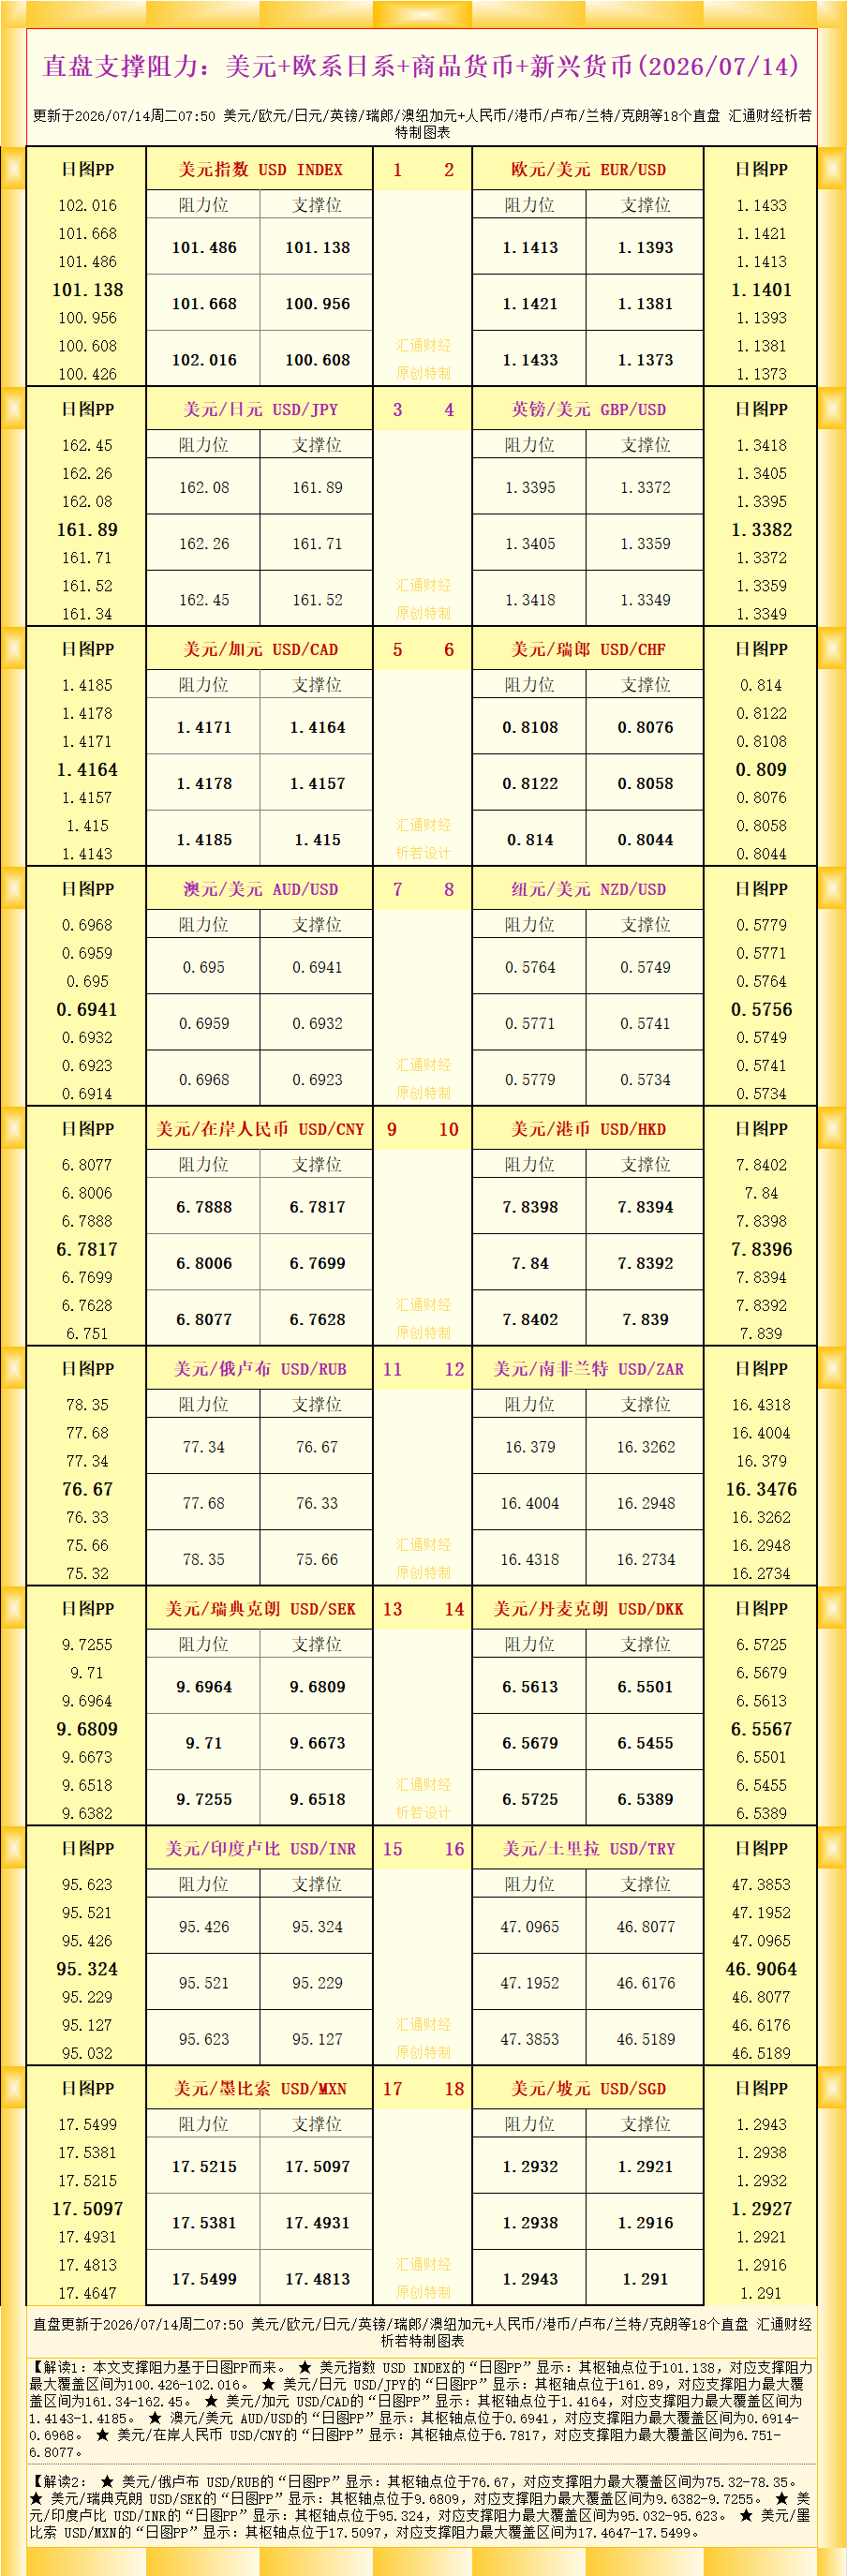 As shown in the chart, Interpretation 1: The support and resistance levels in this article are based on the daily chart's pivot point (PP). ★ The daily PP chart for the US Dollar Index (USD INDEX) shows its pivot point at 101.138, corresponding to a maximum support/resistance range of 100.426-102.016. ★ The daily PP chart for the US Dollar/Japanese Yen (USD/JPY) shows its pivot point at 161.89, corresponding to a maximum support/resistance range of 161.34-162.45. ★ The daily PP chart for the US Dollar/Canadian Dollar (USD/CAD) shows its pivot point at 1.4164, corresponding to a maximum support/resistance range of 1.4143-1.4185. ★ The daily PP chart for the Australian Dollar/US Dollar (AUD/USD) shows its pivot point at 0.6941, corresponding to a maximum support/resistance range of 0.6914-0.6968. ★ The daily chart for USD/CNY shows a pivot point at 6.7817, with a maximum support/resistance range of 6.751-6.8077. Interpretation 2: ★ The daily chart for USD/RUB shows a pivot point at 76.67, with a maximum support/resistance range of 75.32-78.35. ★ The daily chart for USD/SEK shows a pivot point at 9.6809, with a maximum support/resistance range of 9.6382-9.7255. ★ The daily chart for USD/INR shows a pivot point at 95.324, with a maximum support/resistance range of 95.032-95.623. ★ The daily chart for USD/MXN shows a pivot point at 17.5097, corresponding to a maximum support/resistance range of 17.4647-17.5499. See the chart for more detailed analysis of other pairs. Original content by FX678, all rights reserved, for reference only.
As shown in the chart, Interpretation 1: The support and resistance levels in this article are based on the daily chart's pivot point (PP). ★ The daily PP chart for the US Dollar Index (USD INDEX) shows its pivot point at 101.138, corresponding to a maximum support/resistance range of 100.426-102.016. ★ The daily PP chart for the US Dollar/Japanese Yen (USD/JPY) shows its pivot point at 161.89, corresponding to a maximum support/resistance range of 161.34-162.45. ★ The daily PP chart for the US Dollar/Canadian Dollar (USD/CAD) shows its pivot point at 1.4164, corresponding to a maximum support/resistance range of 1.4143-1.4185. ★ The daily PP chart for the Australian Dollar/US Dollar (AUD/USD) shows its pivot point at 0.6941, corresponding to a maximum support/resistance range of 0.6914-0.6968. ★ The daily chart for USD/CNY shows a pivot point at 6.7817, with a maximum support/resistance range of 6.751-6.8077. Interpretation 2: ★ The daily chart for USD/RUB shows a pivot point at 76.67, with a maximum support/resistance range of 75.32-78.35. ★ The daily chart for USD/SEK shows a pivot point at 9.6809, with a maximum support/resistance range of 9.6382-9.7255. ★ The daily chart for USD/INR shows a pivot point at 95.324, with a maximum support/resistance range of 95.032-95.623. ★ The daily chart for USD/MXN shows a pivot point at 17.5097, corresponding to a maximum support/resistance range of 17.4647-17.5499. See the chart for more detailed analysis of other pairs. Original content by FX678, all rights reserved, for reference only.- Risk Warning and Disclaimer
- The market involves risk, and trading may not be suitable for all investors. This article is for reference only and does not constitute personal investment advice, nor does it take into account certain users’ specific investment objectives, financial situation, or other needs. Any investment decisions made based on this information are at your own risk.