What happened in the gold market from $4,200 to $4,000?
2026-07-16 21:58:11
On Thursday, July 16, spot gold failed to find sustained support after two consecutive days of lower-than-expected US inflation data, and currently fell back to around $3,990 per ounce, a daily decline of about 1.8%. Gold prices have fallen by more than 5% in recent months, and the market's pricing focus is shifting from traditional safe-haven logic to a rebalancing of energy shocks, interest rate expectations, and portfolio structure. 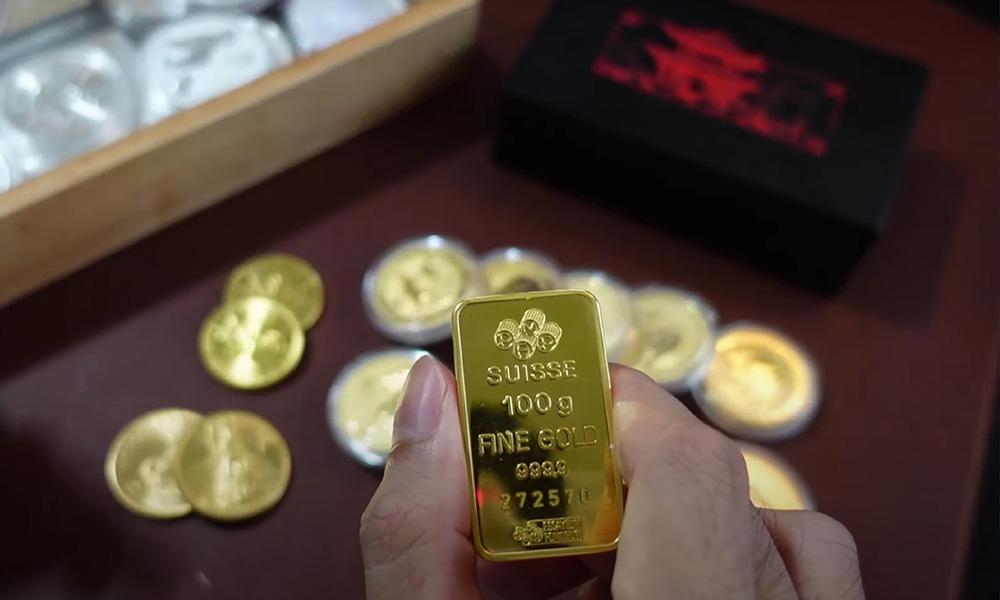
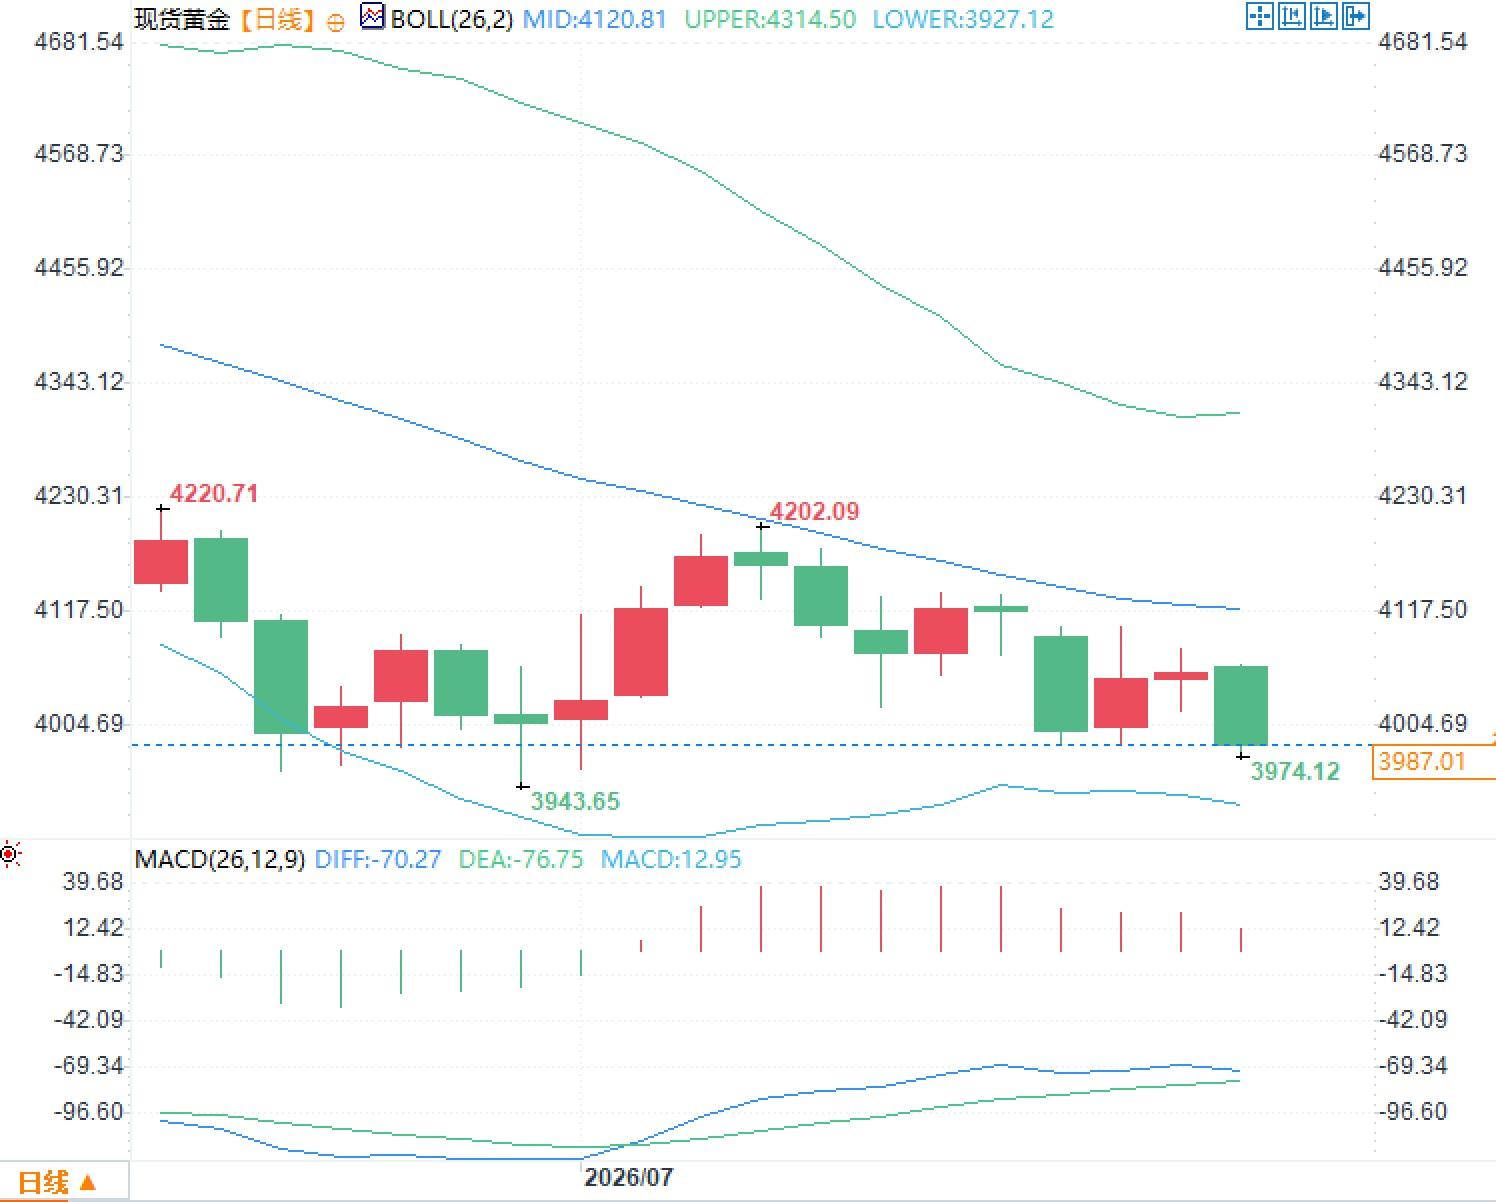 The MACD fast and slow lines remain below the zero axis. Although the histogram has turned positive, its height is gradually narrowing, reflecting a marginal weakening of bearish momentum, but a trend reversal has not yet formed. The $4000 level is not only a psychological barrier but also a densely packed area of daily closes. If the price continues to trade below this level, market attention will shift to the $3970 area and the lower Bollinger Band at $3927. Only a stable recovery above $4120 would indicate that the downward trend has transitioned into a wider consolidation phase.
Why hasn't the cooling of inflation translated into a rise in gold prices?
The U.S. Consumer Price Index (CPI) rose 3.5% year-on-year in June, lower than previously feared by the market, but still significantly above the Federal Reserve's long-term target of 2%. The Producer Price Index (PPI) fell 0.3% month-on-month in June, mainly due to a 1.4% decline in final demand goods prices, with energy prices falling 6.4% and gasoline prices falling 12.0%. However, excluding food, energy, and trade services, the PPI still rose 0.1% month-on-month, with a year-on-year increase of 5.1%. This means that while upstream inflation has temporarily subsided, core service and intermediate input costs have not yet fully cooled. Gold failed to benefit, primarily because the inflation data only reduced the urgency of a recent rate hike, without leading the market to believe that an easing cycle is about to begin. The latest interest rate market still favors the Federal Reserve maintaining its policy rate range of 3.50% to 3.75% at its July meeting. Meanwhile, the two-year Treasury yield rose to 4.155%, the ten-year yield rose to 4.568%, and the dollar index rose slightly to 100.60. For gold, which does not generate interest cash flow, the rising real financing costs and short-term yields are more suppressive than single inflation data.Rising energy prices are changing gold's safe-haven status.
Following the escalation of conflict in the Middle East, West Texas Intermediate crude oil rose to around $80 per barrel, and Brent crude oil rose above $85 per barrel. Rising energy prices typically increase demand for gold as an inflation hedge, but the current market reaction is the opposite. This is because the energy shock first pushed up expectations of interest rate hikes and bond yields. In this environment, gold has two mutually offsetting transmission paths. The first path is increased supply risk, driving safe-haven funds into precious metals. The second path is that oil prices raise the future inflation rate, forcing monetary policy to remain tight and increasing the opportunity cost of holding gold. When the second path dominates, the escalation of conflict not only fails to push up gold prices but may also cause a short-term negative correlation between gold and crude oil. More importantly, the decline in US producer prices in June was highly dependent on a drop in energy prices, while crude oil prices rebounded significantly in July. This means that the latest producer price data has a strong lag and has not yet reflected the current energy shock. Therefore, the market is not simply trading on cooling inflation but is reassessing the speed at which energy costs are transmitted to transportation, manufacturing, and service prices over the next two months.US consumption and employment data reinforced interest rate constraints.
U.S. retail and food service sales reached $768.6 billion in June, up 0.2% month-over-month and 6.7% year-over-year. The May month-over-month increase was revised upward from 0.9% to 1.0%. It's important to note that the confidence interval for the June 0.2% month-over-month change includes zero, indicating that consumption was not accelerating strongly, but there was also no significant contraction sufficient to force a policy shift. The employment side also did not release significant recession signals. For the week ending July 11, initial jobless claims fell to 208,000 from a revised 216,000, and the four-week moving average fell to 214,250. Continuing claims were 1.805 million, and the unemployment coverage ratio remained at 1.2%. This data suggests that corporate pressure to lay off workers remains limited, and the labor market can withstand higher financing costs. The minutes of the Fed's June meeting indicated that labor market conditions remained stable, and many policymakers believed that wage growth and inflation were broadly aligned towards the 2% target. However, the latest monetary policy report reiterated the 2% long-term inflation target, meaning that the improvement in monthly data was insufficient to change policy constraints. Gold is not currently facing an overheated economy, but rather a combination of an economy that is not yet weak enough to require easing, and inflation that may be pushed up again by energy.Technical analysis suggests the market is still in a weak recovery phase.
The daily chart shows the Bollinger Bands with the middle band at $4120.81, the upper band at $4314.50, and the lower band at $3927.12. The price is below the middle band and close to the lower band, indicating a continued weak medium-term trend and a downward shift in the center of gravity. Recent two rebounds above $4200 failed to sustain their upward momentum, and the area around $4120 has transformed from dynamic support into a major technical resistance zone. The MACD fast and slow lines remain below the zero axis. Although the histogram has turned positive, its height is gradually narrowing, reflecting a marginal weakening of bearish momentum, but a trend reversal has not yet formed. The $4000 level is not only a psychological barrier but also a densely packed area of daily closes. If the price continues to trade below this level, market attention will shift to the $3970 area and the lower Bollinger Band at $3927. Only a stable recovery above $4120 would indicate that the downward trend has transitioned into a wider consolidation phase.
- Risk Warning and Disclaimer
- The market involves risk, and trading may not be suitable for all investors. This article is for reference only and does not constitute personal investment advice, nor does it take into account certain users’ specific investment objectives, financial situation, or other needs. Any investment decisions made based on this information are at your own risk.