The recovery of refined oil products is much slower than that of crude oil, and a more hidden supply pressure is forming.
2026-07-20 16:26:15
On Monday, July 20th, the core pricing strategy in the crude oil market rapidly shifted from traditional supply and demand balance to transportation security, export continuity, and inventory buffer capacity. The ongoing conflict between the US and Iran, and reduced traffic on key shipping lanes, further amplified weekend risks. Brent crude rose to $90.87 per barrel, a 3.14% increase on the day, reaching its highest level since June 11th; US crude rose to $84.60 per barrel, after a 15.5% increase in the previous week. The current market movement does not simply reflect production losses, but rather pre-emptively accounts for the combined risks of shipping restrictions, rising insurance costs, and renewed obstacles to the recovery of regional exports. 
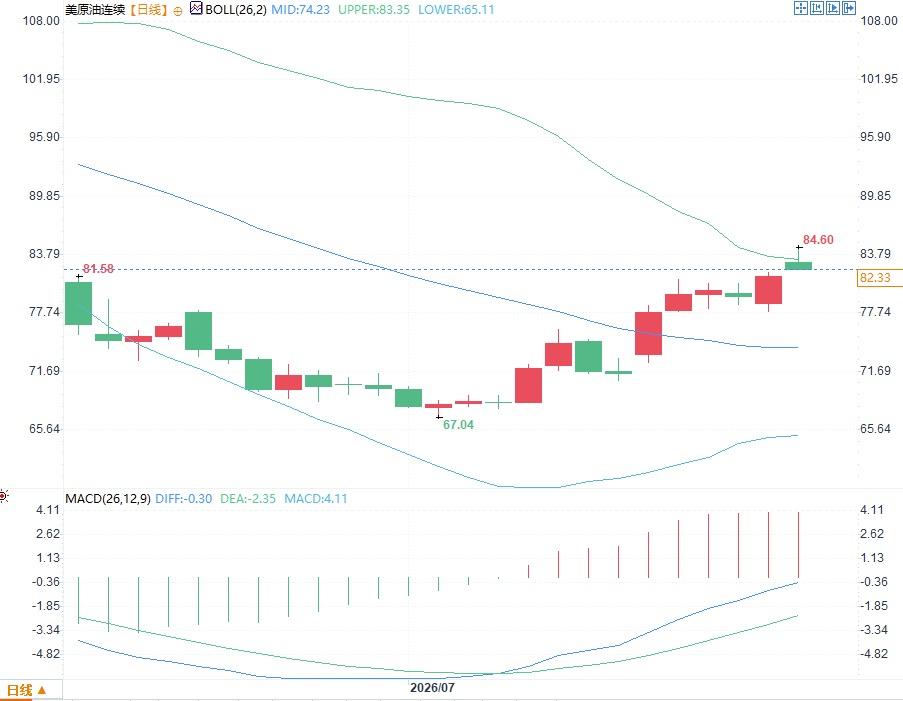 Momentum indicators have also shown significant improvement. The MACD histogram expanded to 4.11, with the fast line at -0.30 and the slow line at -2.35. The fast line continues to approach the zero axis, reflecting a weakening of downward momentum and a shift in price momentum towards the upside. However, the price has moved outside the upper Bollinger Band, meaning volatility is expanding faster than the moving average system, indicating high sensitivity to sudden news. The market's technical focus is shifting from the previous rebound range to the price acceptance level around $82. This is not simply a round number, but a crucial area for determining whether risk premiums can be converted from intraday spikes into sustained pricing. If shipping news is volatile, intraday volatility could be significantly higher than in previous trading phases dominated by inventory data.
Risk premiums are taking over again; oil price breakouts are not solely driven by sentiment.
The immediate trigger for this round of price increases is market expectations of an escalation of the conflict and a further concentration of military resources in the Middle East. As the clashes continue, shipping has become a more sensitive pricing variable than oil field production. Normally, the Strait of Hormuz handles about one-fifth of global oil trade. Once shipowners, insurance companies, or port operators raise risk thresholds, spot availability immediately declines even if actual supply is not completely disrupted. Latest data shows that only four ships passed through the strait last Sunday, compared to eight the previous day. This contraction in shipping traffic means the market cannot simply look at nominal production; it must focus on whether crude oil can be loaded, insured, and arrive at refineries on time. While the news of the two tanker explosions has not been independently verified, its impact on risk pricing has already occurred, as shipowners typically make decisions based on potential losses rather than post-event confirmations. Therefore, crude oil above $80 contains a three-tiered premium: the first is the risk of export restrictions, the second is freight and insurance surcharges, and the third is the possibility that inventory declines may be faster than the market expects. As long as shipping traffic cannot recover steadily, spot premiums and the sensitivity of near-month contracts are likely to continue to be higher than that of far-month contracts.Inventory buffers have thinned, and the market's ability to withstand disruptions has decreased.
A key difference between the current environment and the initial stages of the conflict lies in the reduced storage capacity available to absorb supply shocks. Market analysts point out that current oil inventories are at a level considered tight for the same period over the past five years, meaning that a similar amount of transportation losses could lead to a larger marginal price reaction. Monthly data released in July also shows that Gulf region oil exports increased by 6.5 million barrels per day in June, reaching 16.1 million barrels per day, but this is still significantly lower than the pre-conflict average of approximately 24 million barrels per day. During the same period, global offshore oil inventories increased by 117 million barrels, while onshore inventories decreased by approximately 96 million barrels, including a reduction of approximately 44 million barrels in OECD government reserves. The increase in offshore inventories does not equate to an easing of supply pressure; a significant portion of this is simply a transfer of crude oil from onshore storage tanks to the transportation stage. More concerning is that crude oil exports are recovering significantly faster than refined product exports. In June, Gulf region refined product and liquefied petroleum gas exports were still less than half of pre-conflict levels, and shipments from some key refineries have not yet resumed. This structure means that while the overall crude oil supply appears to have improved, the risk of regional shortages of gasoline, diesel, and jet fuel remains, and crack spreads may continue to bear the pressure of supply mismatch.The technical structure has strengthened, but volatility risk has increased accordingly.
The daily chart shows that US crude oil has rebounded continuously from its low of $67.04, reaching an intraday high of $84.60. The Bollinger Band middle line is at $74.23, the upper line is at $83.35, and the lower line is at $65.11. The price broke through the middle line and immediately touched the upper line area, indicating that the short-term trend has shifted from a corrective rebound to an acceleration phase driven by risk premiums. Momentum indicators have also shown significant improvement. The MACD histogram expanded to 4.11, with the fast line at -0.30 and the slow line at -2.35. The fast line continues to approach the zero axis, reflecting a weakening of downward momentum and a shift in price momentum towards the upside. However, the price has moved outside the upper Bollinger Band, meaning volatility is expanding faster than the moving average system, indicating high sensitivity to sudden news. The market's technical focus is shifting from the previous rebound range to the price acceptance level around $82. This is not simply a round number, but a crucial area for determining whether risk premiums can be converted from intraday spikes into sustained pricing. If shipping news is volatile, intraday volatility could be significantly higher than in previous trading phases dominated by inventory data.
- Risk Warning and Disclaimer
- The market involves risk, and trading may not be suitable for all investors. This article is for reference only and does not constitute personal investment advice, nor does it take into account certain users’ specific investment objectives, financial situation, or other needs. Any investment decisions made based on this information are at your own risk.