As the Hormuz risk continues to escalate, is the gold market trading in a second wave of shocks?
2026-07-20 18:34:13
On Monday, July 20, spot gold was trading around $4,020 per ounce, maintaining a consolidation trend. Meanwhile, the conflict in the Gulf region continued to escalate, with a significant decrease in traffic in key shipping lanes. Brent crude oil briefly rose above $90 per barrel. The coexistence of diplomatic maneuvering and continuous military operations meant that gold was being priced in by three intertwined factors: safe-haven demand, inflation expectations, and dollar liquidity. 
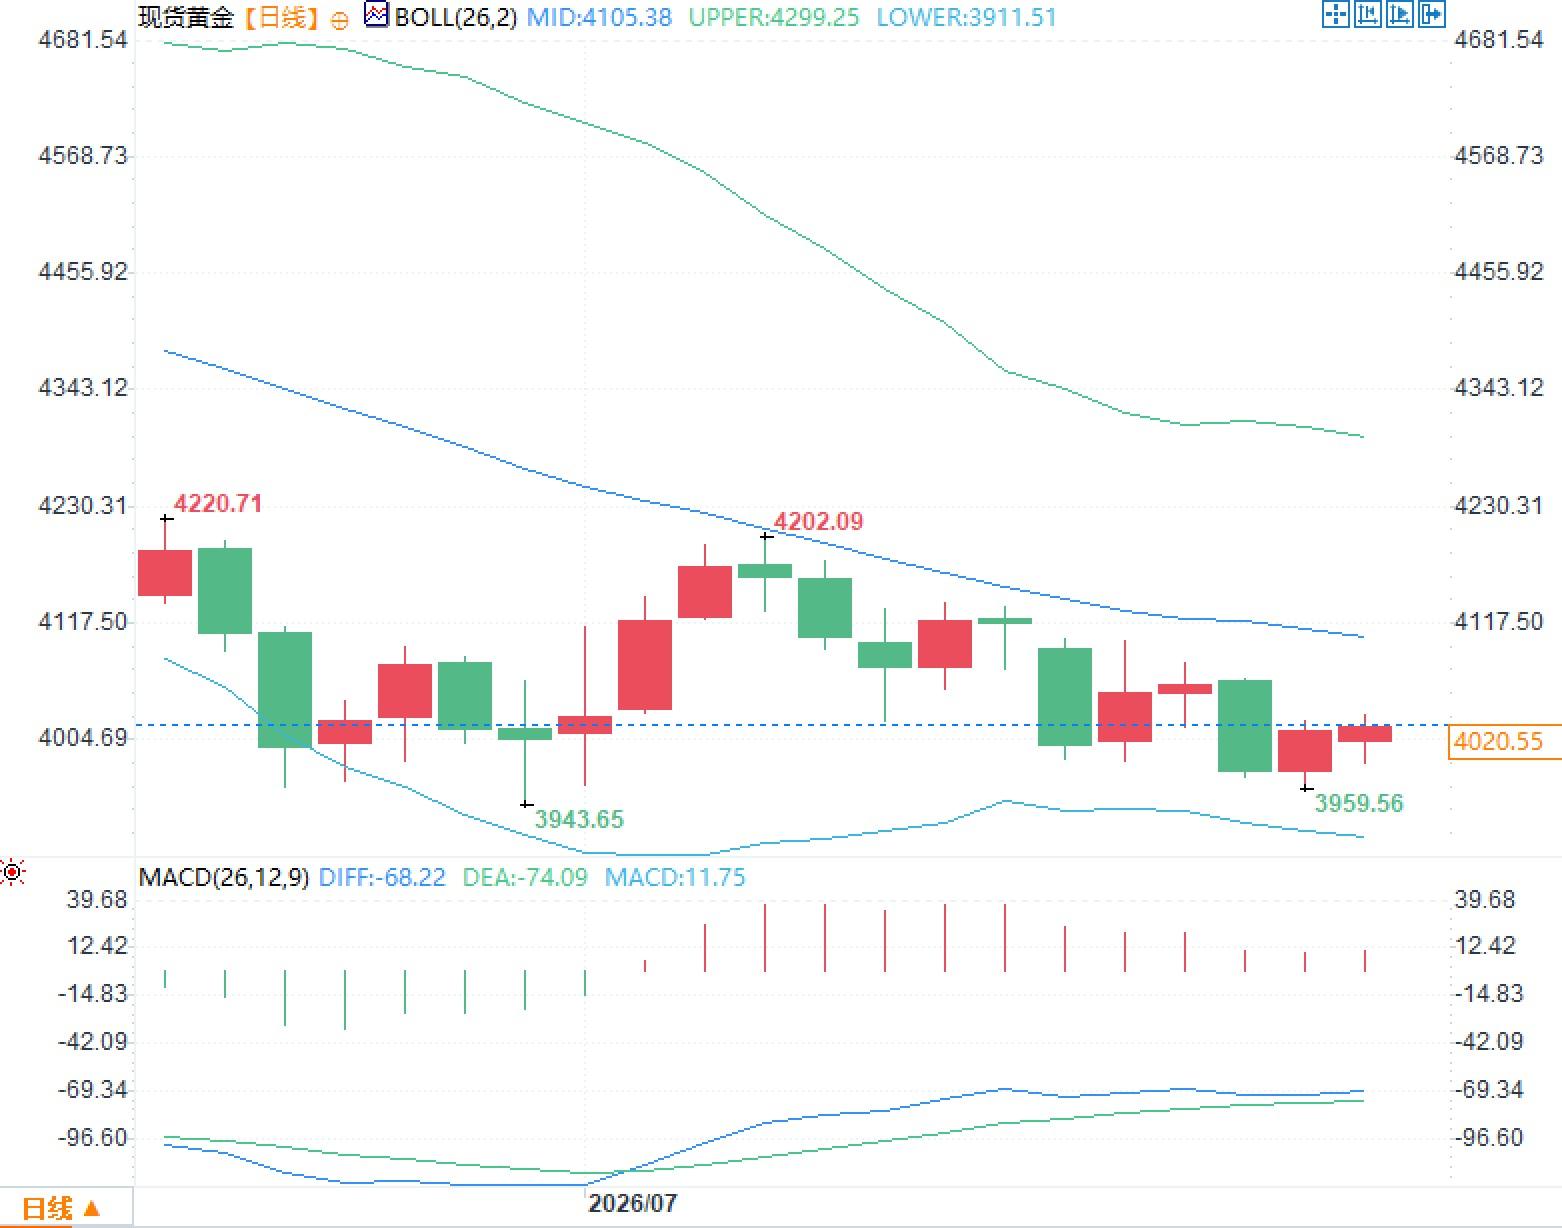 In the MACD indicator, the DIFF is -68.22, the DEA is -74.09, and the histogram has rebounded to 11.75. The DIFF has risen above the DEA again, reflecting a weakening of downward momentum. However, both lines are still below the zero line, indicating a more likely weak correction than a complete trend reversal. Structurally, the $4000 level is a psychologically important area where bulls and bears repeatedly battle in the short term. The $3959-$3912 range will determine whether the correction will extend further. The $4105 level is a key level for judging whether the price can regain its medium-term strength.
Why didn't gold experience a one-sided upward surge despite diplomatic signals?
Iran has stated that recent diplomatic activity has been relatively active, with several mediators submitting proposals to resume negotiations, and emphasizing that diplomacy and defense are not contradictory. On the surface, this news reduces the probability of the situation immediately spiraling out of control, but the market has not equated it with the risk being eliminated. This is because diplomatic contacts have not yet addressed core differences such as shipping lane management, the nuclear issue, and security arrangements; the ceasefire framework had already weakened significantly, and military operations have not been simultaneously scaled back. Gold's response is a risk premium correction rather than a trend reversal. As long as mediation remains at the stage of conveying proposals and expressing willingness to negotiate, safe-haven funds are unlikely to withdraw completely; however, as long as neither side further expands its target range, new safe-haven buying will also tend to be cautious. Prices are therefore more likely to fluctuate within a high-volatility range, rather than replicating the previous rapid upward trajectory. This means that the key to current gold pricing is not whether diplomatic communication exists, but whether such communication can translate into the resumption of shipping, a decrease in the frequency of attacks, and a contraction in energy supply risks. Without these verifiable results, diplomatic news will primarily affect intraday volatility and is unlikely to independently change the medium-term structure.Crude oil once broke through $90, while gold trading was driven by second-order inflation shocks.
Key shipping routes handle a significant portion of global crude oil and liquefied natural gas transport. With reduced ship traffic, transportation insurance, detour costs, and energy risk premiums have risen simultaneously, briefly pushing Brent crude back above $90 per barrel. The impact of rising energy prices on gold is not simply a matter of safe-haven demand, but rather a second-order transmission through inflation expectations and real interest rates. If high oil prices are short-lived, the market primarily trades on supply disruption risks, and gold typically receives event-driven support. If high oil prices persist for weeks or longer, inflation expectations may rise again, leading to higher bond yields. While gold retains its inflation-hedging properties, it will also be suppressed by rising real interest rates and holding costs. Therefore, oil prices breaking through $90 do not necessarily correspond to a straight rise in gold prices. What truly determines gold price elasticity is whether an energy shock can drive up inflation expectations without forcing a significant shift in interest rate expectations towards tightening. Currently, both of these directions coexist, which is a key reason why gold is frequently fluctuating around $4,000.The dollar and interest rate constraints remain, and safe-haven flows have not yet converged.
The current US dollar index is around 100.76, with limited changes over the past month. The dollar has not strengthened significantly due to conflict risks, nor has it shown a clear downward trend, indicating that global funds are still diversified among dollar cash, short-term bonds, and gold. The Federal Reserve maintained the target range for the federal funds rate at 3.50% to 3.75% at its June meeting, with the next policy meeting scheduled for July 28-29. High policy rates continue to constrain non-interest-bearing assets by opportunity costs. The market is focused on whether rising energy prices will push up inflation, while also assessing the drag on demand and business costs from conflict. This combination is not entirely positive for gold. Safe-haven demand provides a floor, while high interest rates and a stable dollar limit valuation expansion. Only a significant decline in real yields or a continued escalation of conflict risks will make it easier for gold to break out of its current trading range. If energy prices fall and diplomatic negotiations make substantial progress, the risk premium may be further compressed.Technical analysis points to a weak recovery, with $4105 becoming a watershed.
The daily chart shows that gold has retreated from its previous highs of $4220.71 and $4202.09, and is currently trading below the Bollinger Band middle line at $4105.38. The downward sloping middle and upper Bollinger Bands indicate that medium-term pressure has not yet subsided. The lower Bollinger Band is located at $3911.51, and the recent low of $3959.56 and the previous low of $3943.65 form a dense support area. In the MACD indicator, the DIFF is -68.22, the DEA is -74.09, and the histogram has rebounded to 11.75. The DIFF has risen above the DEA again, reflecting a weakening of downward momentum. However, both lines are still below the zero line, indicating a more likely weak correction than a complete trend reversal. Structurally, the $4000 level is a psychologically important area where bulls and bears repeatedly battle in the short term. The $3959-$3912 range will determine whether the correction will extend further. The $4105 level is a key level for judging whether the price can regain its medium-term strength.
- Risk Warning and Disclaimer
- The market involves risk, and trading may not be suitable for all investors. This article is for reference only and does not constitute personal investment advice, nor does it take into account certain users’ specific investment objectives, financial situation, or other needs. Any investment decisions made based on this information are at your own risk.