Will gold replicate the super bull market of 1978?
2026-07-24 17:57:30
On Friday (July 24), international spot gold prices remained around $4,055 per ounce, up slightly by 0.14% on the day. However, considering the medium- to long-term market logic, institutions remain optimistic about the future trend of gold. Short-term price corrections are merely normal consolidation within an upward cycle and not a signal of the end of the bull market. Industry analysts have given a clear medium- to long-term price forecast: international gold prices are expected to climb to around $5,000 per ounce by the end of 2026, with the upward trend continuing, and are projected to further rise to $5,600 per ounce by the end of 2027.  From a historical cycle perspective, the current gold market's operating rhythm is highly similar to that of 1978. In 1978, gold underwent a prolonged period of range-bound consolidation, fully absorbing floating market sentiment and accumulating upward momentum before initiating the strongest and most rapid bull market in modern financial history. The core driving logic of that year's market was concentrated in three dimensions: rampant high inflation, escalating global geopolitical risks, and an overall bullish trend in commodities. The current market is simultaneously replicating this core favorable system, with gold's investment value and risk-reward ratio continuously improving, attracting sustained medium- to long-term capital investment. The core of the cycle comparison: 1978 served as a prelude to the ultimate bull market in gold . The market is deeply comparing the 2026 gold market with that of 1978, based on the high degree of structural similarity between the two bull market cycles: both the current market and the gold market in 1978 experienced a period of correction and adjustment in the later stages of a long bull market. After this brief period of consolidation, the ultimate upward phase of the entire long bull market, characterized by its strongest explosive power, largest gains, and most extreme price movements, will begin. The gold bull market from 1978 to 1980 is a classic and representative market trend in the history of global commodities. At that time, the global economy was mired in stagflation, with sluggish economic growth and soaring prices. This was compounded by geopolitical turmoil triggered by the Iranian Revolution and the full-blown second oil crisis. Multiple factors negatively impacting the economy and positively impacting safe-haven assets converged. In just one and a half years, the price of gold surged from around $200 per ounce in 1978 to a historical high of $850 per ounce in January 1980, an increase of over 320%, setting a record for the short-term gains in gold over decades and becoming one of the most spectacular commodity bull markets in modern financial history. The five core driving factors of the 1979 gold super bull market : 1979 became a key turning point for the full-blown gold market boom. Multiple positive fundamental factors combined to give rise to a global commodity bull market covering crude oil, precious metals, industrial metals, and agricultural products. Gold, with its dual attributes of being a safe haven and an inflation hedge, became the leading performer. The specific core driving factors are as follows: 1. The second oil crisis triggered global inflation. Following the Iranian Revolution, Iran's oil production and export system was completely paralyzed, leading to a significant contraction in global oil supply and a near doubling of international oil prices. As a core global industrial cost, the surge in oil prices quickly spread throughout the entire industry chain, triggering global imported inflation. Prices rose across the board, completely shattering the then-stable price system and laying a solid foundation for gold's anti-inflationary performance. 2. The global high-inflation situation spiraled out of control. Impacted by both the oil crisis and excessive money supply, inflation rates in the US and most developed economies in Europe and North America rapidly exceeded double digits, with rampant inflation continuously eroding market asset values. The purchasing power of fiat currencies shrank significantly, and traditional stable assets such as cash, savings, and bonds continued to depreciate. The market urgently needed high-quality assets to hedge against inflation risks, leading to a surge in demand for gold. 3. The continued weakening of the US dollar forced capital outflows to seek safe havens. Multiple pressures, including economic stagflation, high inflation, and a widening trade deficit, caused the US dollar to continue to decline, and the dollar's credibility was widely questioned by the market. Investors have completely abandoned single-dollar-denominated assets, massively increasing their holdings of gold, silver, and other non-sovereign credit hard currencies, using them as core value stores, further pushing up gold valuations. 4. A concentrated outbreak of geopolitical risks boosted safe-haven buying. A series of geopolitical conflicts, including the Iranian Revolution, the Tehran hostage crisis, and the Afghan War, have unfolded, causing severe turmoil in the global political landscape. Market uncertainty has surged, risk assets have become more volatile and yields have been low, leading to a comprehensive increase in risk aversion and a continuous influx of funds into highly safe-haven assets like gold. 5. A global commodity bull market has created a ripple effect. This round of market activity is not just a rise in gold, but a systemic bull market across all commodity categories. Crude oil, industrial metals, agricultural products, and other commodities have all strengthened, creating a strong sector-wide upward trend. Market sentiment towards commodities has spread comprehensively, further propelling gold to more than double its value. Current market situation: Short-term consolidation, fundamentals continue the bull market logic Based on current real-time market data, gold's short-term trend shows a volatile and fluctuating pattern, with relatively intense competition between bulls and bears. Currently, spot gold is fluctuating within a range of $3390-$3405 per ounce, with no clear directional trend. This is a typical high-level consolidation phase, perfectly matching the characteristics of the shakeout before the start of the 1978 bull market. Recent price fluctuations are mainly due to a temporary recovery in market risk sentiment and a short-term cooling of geopolitical safe-haven demand, leading to a slight pullback in gold prices. However, the core long-term bullish logic remains unchanged. Looking at upcoming key market events, the US July inflation data and speeches by Federal Reserve officials will dominate short-term gold price fluctuations. The market is awaiting guidance from inflation data and monetary policy signals. Currently, the Federal Reserve's benchmark interest rate remains stable at 4.5%, with no significant rate hikes or cuts expected. Overall, monetary policy is moderately loose, providing a mild monetary environment for medium- to long-term gold price increases. Meanwhile, the US June wholesale inventory growth rate fell short of expectations, and second-quarter labor productivity rebounded sharply, indicating a weak recovery in the US economy and the initial signs of stagflation, further aligning with the macroeconomic background of the 1970s bull market. Market Comparison: Differentiated Trading Logic Under Similar Core Elements
 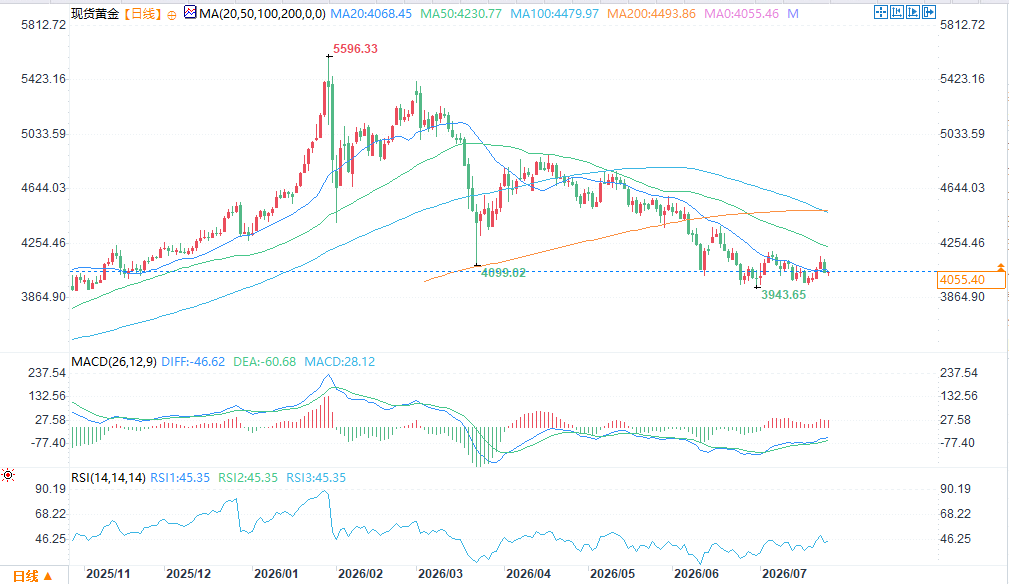 (Spot gold daily chart source: FX678) The super bull market in gold from 1978 to 1980 is the core historical basis for current institutional predictions of this long-term bull market in gold. Most analysts have clearly pointed out that the recent price correction in gold is merely a healthy consolidation within the long-term bull market, primarily aimed at clearing out short-term speculative positions and solidifying the foundation for medium- to long-term gains, and is by no means a signal of the end of this bull market. The current macroeconomic environment shares several core commonalities with the late 1970s: continuously rising global geopolitical uncertainty, continuously expanding sovereign debt levels in various countries, widening fiscal deficits, continuous large-scale increases in gold reserves by global central banks, and a gradual weakening of market confidence in fiat currencies. The three core logics of stagflation risk, weakening monetary credibility, and rising demand for safe-haven assets resonate simultaneously, highly matching the market environment before the start of the 1978 bull market. However, investors need to view historical benchmarks rationally and dialectically, and should not blindly replicate historical market trends. The current global monetary policy system, the degree of economic globalization, market trading mechanisms, and capital flow efficiency are fundamentally different from those of the 1970s. The 1970s saw a full-blown outbreak of hyperinflation, while current inflation is generally controllable, with more moderate fluctuations, and monetary policy adjustments are more mature and flexible. Therefore, the pace, volatility, and duration of this gold bull market will differ from historical trends. Investors need to rely on current market data and macroeconomic events to rationally plan for the medium to long term.
From a historical cycle perspective, the current gold market's operating rhythm is highly similar to that of 1978. In 1978, gold underwent a prolonged period of range-bound consolidation, fully absorbing floating market sentiment and accumulating upward momentum before initiating the strongest and most rapid bull market in modern financial history. The core driving logic of that year's market was concentrated in three dimensions: rampant high inflation, escalating global geopolitical risks, and an overall bullish trend in commodities. The current market is simultaneously replicating this core favorable system, with gold's investment value and risk-reward ratio continuously improving, attracting sustained medium- to long-term capital investment. The core of the cycle comparison: 1978 served as a prelude to the ultimate bull market in gold . The market is deeply comparing the 2026 gold market with that of 1978, based on the high degree of structural similarity between the two bull market cycles: both the current market and the gold market in 1978 experienced a period of correction and adjustment in the later stages of a long bull market. After this brief period of consolidation, the ultimate upward phase of the entire long bull market, characterized by its strongest explosive power, largest gains, and most extreme price movements, will begin. The gold bull market from 1978 to 1980 is a classic and representative market trend in the history of global commodities. At that time, the global economy was mired in stagflation, with sluggish economic growth and soaring prices. This was compounded by geopolitical turmoil triggered by the Iranian Revolution and the full-blown second oil crisis. Multiple factors negatively impacting the economy and positively impacting safe-haven assets converged. In just one and a half years, the price of gold surged from around $200 per ounce in 1978 to a historical high of $850 per ounce in January 1980, an increase of over 320%, setting a record for the short-term gains in gold over decades and becoming one of the most spectacular commodity bull markets in modern financial history. The five core driving factors of the 1979 gold super bull market : 1979 became a key turning point for the full-blown gold market boom. Multiple positive fundamental factors combined to give rise to a global commodity bull market covering crude oil, precious metals, industrial metals, and agricultural products. Gold, with its dual attributes of being a safe haven and an inflation hedge, became the leading performer. The specific core driving factors are as follows: 1. The second oil crisis triggered global inflation. Following the Iranian Revolution, Iran's oil production and export system was completely paralyzed, leading to a significant contraction in global oil supply and a near doubling of international oil prices. As a core global industrial cost, the surge in oil prices quickly spread throughout the entire industry chain, triggering global imported inflation. Prices rose across the board, completely shattering the then-stable price system and laying a solid foundation for gold's anti-inflationary performance. 2. The global high-inflation situation spiraled out of control. Impacted by both the oil crisis and excessive money supply, inflation rates in the US and most developed economies in Europe and North America rapidly exceeded double digits, with rampant inflation continuously eroding market asset values. The purchasing power of fiat currencies shrank significantly, and traditional stable assets such as cash, savings, and bonds continued to depreciate. The market urgently needed high-quality assets to hedge against inflation risks, leading to a surge in demand for gold. 3. The continued weakening of the US dollar forced capital outflows to seek safe havens. Multiple pressures, including economic stagflation, high inflation, and a widening trade deficit, caused the US dollar to continue to decline, and the dollar's credibility was widely questioned by the market. Investors have completely abandoned single-dollar-denominated assets, massively increasing their holdings of gold, silver, and other non-sovereign credit hard currencies, using them as core value stores, further pushing up gold valuations. 4. A concentrated outbreak of geopolitical risks boosted safe-haven buying. A series of geopolitical conflicts, including the Iranian Revolution, the Tehran hostage crisis, and the Afghan War, have unfolded, causing severe turmoil in the global political landscape. Market uncertainty has surged, risk assets have become more volatile and yields have been low, leading to a comprehensive increase in risk aversion and a continuous influx of funds into highly safe-haven assets like gold. 5. A global commodity bull market has created a ripple effect. This round of market activity is not just a rise in gold, but a systemic bull market across all commodity categories. Crude oil, industrial metals, agricultural products, and other commodities have all strengthened, creating a strong sector-wide upward trend. Market sentiment towards commodities has spread comprehensively, further propelling gold to more than double its value. Current market situation: Short-term consolidation, fundamentals continue the bull market logic Based on current real-time market data, gold's short-term trend shows a volatile and fluctuating pattern, with relatively intense competition between bulls and bears. Currently, spot gold is fluctuating within a range of $3390-$3405 per ounce, with no clear directional trend. This is a typical high-level consolidation phase, perfectly matching the characteristics of the shakeout before the start of the 1978 bull market. Recent price fluctuations are mainly due to a temporary recovery in market risk sentiment and a short-term cooling of geopolitical safe-haven demand, leading to a slight pullback in gold prices. However, the core long-term bullish logic remains unchanged. Looking at upcoming key market events, the US July inflation data and speeches by Federal Reserve officials will dominate short-term gold price fluctuations. The market is awaiting guidance from inflation data and monetary policy signals. Currently, the Federal Reserve's benchmark interest rate remains stable at 4.5%, with no significant rate hikes or cuts expected. Overall, monetary policy is moderately loose, providing a mild monetary environment for medium- to long-term gold price increases. Meanwhile, the US June wholesale inventory growth rate fell short of expectations, and second-quarter labor productivity rebounded sharply, indicating a weak recovery in the US economy and the initial signs of stagflation, further aligning with the macroeconomic background of the 1970s bull market. Market Comparison: Differentiated Trading Logic Under Similar Core Elements (Spot gold daily chart source: FX678) The super bull market in gold from 1978 to 1980 is the core historical basis for current institutional predictions of this long-term bull market in gold. Most analysts have clearly pointed out that the recent price correction in gold is merely a healthy consolidation within the long-term bull market, primarily aimed at clearing out short-term speculative positions and solidifying the foundation for medium- to long-term gains, and is by no means a signal of the end of this bull market. The current macroeconomic environment shares several core commonalities with the late 1970s: continuously rising global geopolitical uncertainty, continuously expanding sovereign debt levels in various countries, widening fiscal deficits, continuous large-scale increases in gold reserves by global central banks, and a gradual weakening of market confidence in fiat currencies. The three core logics of stagflation risk, weakening monetary credibility, and rising demand for safe-haven assets resonate simultaneously, highly matching the market environment before the start of the 1978 bull market. However, investors need to view historical benchmarks rationally and dialectically, and should not blindly replicate historical market trends. The current global monetary policy system, the degree of economic globalization, market trading mechanisms, and capital flow efficiency are fundamentally different from those of the 1970s. The 1970s saw a full-blown outbreak of hyperinflation, while current inflation is generally controllable, with more moderate fluctuations, and monetary policy adjustments are more mature and flexible. Therefore, the pace, volatility, and duration of this gold bull market will differ from historical trends. Investors need to rely on current market data and macroeconomic events to rationally plan for the medium to long term.
- Risk Warning and Disclaimer
- The market involves risk, and trading may not be suitable for all investors. This article is for reference only and does not constitute personal investment advice, nor does it take into account certain users’ specific investment objectives, financial situation, or other needs. Any investment decisions made based on this information are at your own risk.