Gold prices held above $4,020, but the risk of interest rates from the Federal Reserve limited the upside potential.
2026-07-24 22:41:01
Gold and silver prices rose during the US trading session on Friday (July 24). Precious metals stabilized after Thursday's sell-off; traders weighed multiple factors: strong signals from the US labor market, the European Central Bank keeping interest rates unchanged, persistently high international oil prices, and firm US Treasury yields. At the time of writing, spot gold was trading around $4055.00 per ounce, up 0.16% on the day; spot silver was quoted around $58.31, up 1.35% on the day.  Gold traded in a range of $4021.20 to $4064.90 in early trading, holding above Thursday's lows but remaining below the two resistance levels indicated by the latest technical charts: $4067 and $4139. Silver traded in a range of $56.98 to $58.76 in early trading, rebounding above the 50-period moving average near $58.22, but still below the resistance range of $58.56 to $59.94. Following the release of the latest key economic data, market sentiment cooled significantly compared to the easing expectations suggested by the lower-than-expected CPI and PPI data. The European Central Bank maintained its deposit rate at 2.25%, the main refinancing rate at 2.40%, and the marginal lending rate at 2.65%; the central bank continues to monitor the strength and duration of energy price shocks. Initial jobless claims in the US for the week ending July 18 fell by 22,000 to 187,000, the lowest level since September 1969; the previous week's data was revised upward to 209,000. This data confirms market views: although job growth has slowed, layoffs remain at historically low levels. The 10-year US Treasury yield is around 4.70%, and the US dollar index is hovering around 101.39. Geopolitical risks provide support for gold, but strong US Treasury yields and a strengthening dollar limit upside potential. The current shipping situation in the Strait of Hormuz can be summarized as follows: the waterway is not blocked, but the shipping environment is highly tense, facing continued pressure from military and shipping competition, and is far from returning to normal operations. The focus of the US-Iran conflict remains control of this waterway; Houthi attacks on Saudi oil tankers in the Red Sea further expand the scope of shipping risks, increasing pressure on Gulf oil export routes. Brent crude has retreated from its high above $102, trading at around $97.67; US WTI crude is near $89.76. Although oil prices have retreated from their highs, the energy risk premium remains. For gold, the aforementioned situation has a two-way impact: geopolitical safe-haven demand is favorable for gold prices; however, high oil prices are pushing up inflation expectations, supporting US Treasury yields, and thus suppressing the upside potential of gold as a non-interest-bearing asset. Looking at the overall market landscape: oil prices remain high, US Treasury yields are firm, and the US dollar remains stable; silver, on the other hand, is showing greater resilience among precious metals. Traders are closely watching the following clues: speeches by Federal Reserve officials (the Fed will announce its interest rate decision next week on July 29), preliminary manufacturing purchasing managers' data, subsequent changes in initial jobless claims data, and whether there are new disruptions to shipping in the Strait of Hormuz and the Red Sea. If gold prices continue to hold above $4067, the short-term technical outlook will improve; once it falls below $4030, market focus will refocus on the $3998 support level. Major international market conditions: WTI crude oil prices have fallen but remain high, trading around $89.76 per barrel; Brent crude oil is around $97.67. The US dollar index held steady around 101.39; the benchmark 10-year US Treasury yield traded around 4.70%. Technical Analysis
 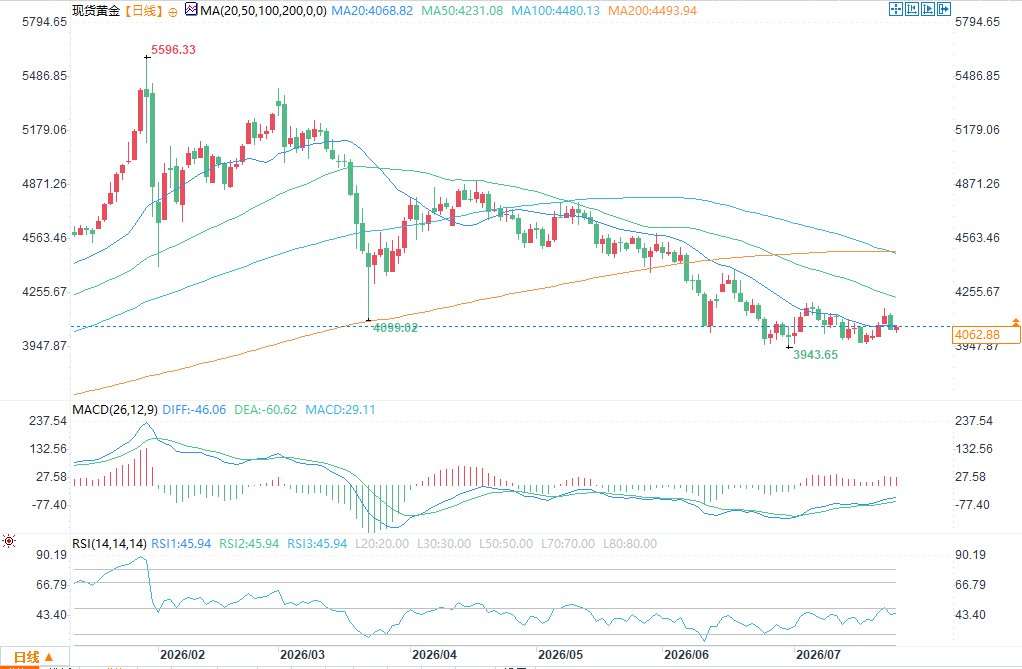 (Spot Gold Daily Chart Source: EasyTrade) Gold prices have been in a medium-term downtrend since the high of 5596, consistently trading below multiple moving averages including the 20-day, 50-day, and 100-day moving averages. The medium-term downtrend has not reversed. The previous low was 3943.65, and prices are currently consolidating in a narrow range around 4055, representing a low-level consolidation after the sharp drop. The primary resistance level is the 20-day moving average (4068); a break above this level is needed to open up room for a rebound. The core support level is the low of 3943. The MACD is below the zero line, with the DIFF and DEA lines turning upwards from a low level and the red bars expanding moderately, releasing a short-term bottoming and repair signal. However, a valid golden cross has not yet formed to break through the zero line, so this can only be defined as a rebound rather than a reversal. The RSI has stabilized in the 45 range, moving out of the oversold area, indicating a slight recovery in short-term bullish momentum. The 70 level is a key level to determine the strength of the rebound. The medium-term overall structure remains bearish; the current movement is merely a technical correction after the decline. In the short term, pay attention to whether it can effectively stand above the 4068 moving average resistance; if it falls back under pressure, it will likely retest the 3943 support; only by continuously breaking through the 4230 level can the current medium-term downward structure be reversed.
Gold traded in a range of $4021.20 to $4064.90 in early trading, holding above Thursday's lows but remaining below the two resistance levels indicated by the latest technical charts: $4067 and $4139. Silver traded in a range of $56.98 to $58.76 in early trading, rebounding above the 50-period moving average near $58.22, but still below the resistance range of $58.56 to $59.94. Following the release of the latest key economic data, market sentiment cooled significantly compared to the easing expectations suggested by the lower-than-expected CPI and PPI data. The European Central Bank maintained its deposit rate at 2.25%, the main refinancing rate at 2.40%, and the marginal lending rate at 2.65%; the central bank continues to monitor the strength and duration of energy price shocks. Initial jobless claims in the US for the week ending July 18 fell by 22,000 to 187,000, the lowest level since September 1969; the previous week's data was revised upward to 209,000. This data confirms market views: although job growth has slowed, layoffs remain at historically low levels. The 10-year US Treasury yield is around 4.70%, and the US dollar index is hovering around 101.39. Geopolitical risks provide support for gold, but strong US Treasury yields and a strengthening dollar limit upside potential. The current shipping situation in the Strait of Hormuz can be summarized as follows: the waterway is not blocked, but the shipping environment is highly tense, facing continued pressure from military and shipping competition, and is far from returning to normal operations. The focus of the US-Iran conflict remains control of this waterway; Houthi attacks on Saudi oil tankers in the Red Sea further expand the scope of shipping risks, increasing pressure on Gulf oil export routes. Brent crude has retreated from its high above $102, trading at around $97.67; US WTI crude is near $89.76. Although oil prices have retreated from their highs, the energy risk premium remains. For gold, the aforementioned situation has a two-way impact: geopolitical safe-haven demand is favorable for gold prices; however, high oil prices are pushing up inflation expectations, supporting US Treasury yields, and thus suppressing the upside potential of gold as a non-interest-bearing asset. Looking at the overall market landscape: oil prices remain high, US Treasury yields are firm, and the US dollar remains stable; silver, on the other hand, is showing greater resilience among precious metals. Traders are closely watching the following clues: speeches by Federal Reserve officials (the Fed will announce its interest rate decision next week on July 29), preliminary manufacturing purchasing managers' data, subsequent changes in initial jobless claims data, and whether there are new disruptions to shipping in the Strait of Hormuz and the Red Sea. If gold prices continue to hold above $4067, the short-term technical outlook will improve; once it falls below $4030, market focus will refocus on the $3998 support level. Major international market conditions: WTI crude oil prices have fallen but remain high, trading around $89.76 per barrel; Brent crude oil is around $97.67. The US dollar index held steady around 101.39; the benchmark 10-year US Treasury yield traded around 4.70%. Technical Analysis (Spot Gold Daily Chart Source: EasyTrade) Gold prices have been in a medium-term downtrend since the high of 5596, consistently trading below multiple moving averages including the 20-day, 50-day, and 100-day moving averages. The medium-term downtrend has not reversed. The previous low was 3943.65, and prices are currently consolidating in a narrow range around 4055, representing a low-level consolidation after the sharp drop. The primary resistance level is the 20-day moving average (4068); a break above this level is needed to open up room for a rebound. The core support level is the low of 3943. The MACD is below the zero line, with the DIFF and DEA lines turning upwards from a low level and the red bars expanding moderately, releasing a short-term bottoming and repair signal. However, a valid golden cross has not yet formed to break through the zero line, so this can only be defined as a rebound rather than a reversal. The RSI has stabilized in the 45 range, moving out of the oversold area, indicating a slight recovery in short-term bullish momentum. The 70 level is a key level to determine the strength of the rebound. The medium-term overall structure remains bearish; the current movement is merely a technical correction after the decline. In the short term, pay attention to whether it can effectively stand above the 4068 moving average resistance; if it falls back under pressure, it will likely retest the 3943 support; only by continuously breaking through the 4230 level can the current medium-term downward structure be reversed.
- Risk Warning and Disclaimer
- The market involves risk, and trading may not be suitable for all investors. This article is for reference only and does not constitute personal investment advice, nor does it take into account certain users’ specific investment objectives, financial situation, or other needs. Any investment decisions made based on this information are at your own risk.