Geopolitical risks in the Middle East continue to escalate, with the $4,000 mark becoming the core of the game over the weekend.
2026-07-25 00:55:01
As this week's trading draws to a close, the gold market is showing signs of a bullish reversal. However, at the same time, gold prices are also on the verge of starting a new downward trend, with the $4,000 level becoming a critical point for the battle between bulls and bears, and a key price level to watch in the entire gold trading market.  Seasonal positive factors for gold typically begin to emerge in July, with support strengthening further in August. Historically, gold has a higher probability of rising and better average returns during this period. Currently, gold prices have fallen by 30% from their year-to-date high to recent lows, suggesting reasonable room for a technical rebound. It's worth noting that whenever I express a bullish view, online opinions are mostly opposed. As a contrarian trader, I believe this widespread pessimism is precisely a signal for optimism, not a risk warning. Gold Futures Technical Analysis From a weekly chart perspective, gold has fallen by nearly 30% this year, with a clear downward trend. However, in the past four weeks, bears have consistently failed to push gold prices below the $4000 level and sustain their decline. Simultaneously, weekly trading volume for gold has continued to shrink, which is completely inconsistent with the typical volume and price characteristics of a deep bear market. Furthermore, the continued decline in long positions in the gold futures market indicates that this round of price declines is likely just a deep correction within a long-term upward trend, not the beginning of the end of a multi-year bull market. Three weeks ago, gold closed with a bullish hammer candlestick on the weekly chart, and the price has consistently held above the low of that candlestick. As of the close of this week, gold is again forming an inverted hammer pattern near the $4000 level. Until gold makes a decisive breakout or closes firmly below the recent low on the daily chart, a significant rebound remains possible. Crude oil and a strong US dollar remain the biggest headwinds for gold bulls . The core factor currently suppressing a gold rebound is the persistently strong US dollar. However, if tensions in the Middle East gradually ease, the dollar is likely to correct, potentially providing a key driver for a gold rebound. Even so, I remain optimistic about the future trend of the US dollar index, expecting it to further test the 102 level. If this prediction comes true, gold will likely first retest recent lows before initiating the anticipated reversal and rebound. If gold prices break below the current support level, the next key support levels to watch are 3900 (October low), 3776.4 (100-week exponential moving average), and 3680.6 (September volume level). Conversely, if gold prices hold above recent lows, the key resistance levels are 4200 and 4300. With risks escalating over the weekend, the 4000 level has become the market's central focus.
 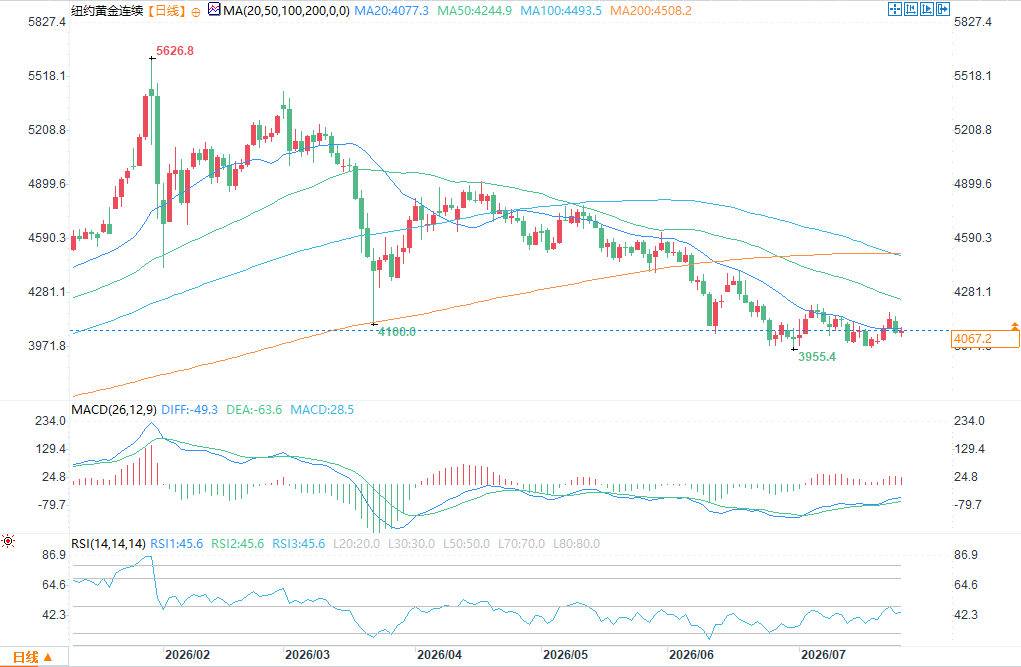 (COMEX Gold Daily Chart Source: FX678) Gold prices plunged over 1% on Thursday, marking its worst performance in eight trading days, with short-term market sentiment completely shifting towards the bears. However, the support level of $4,000 remains significant. Most traders are closely watching this level, and institutional portfolio managers are likely to allocate gold to hedge against weekend geopolitical risks, further strengthening the support at this level. The geopolitical risk of a gap-up opening in crude oil prices this weekend could put pressure on market risk sentiment at the start of Monday's trading. However, if institutional funds concentrate on buying gold for hedging, gold prices are expected to hold recent lows, at least avoiding a deep decline. From a purely technical perspective, a pullback to the $4,000 level would likely trigger a small rebound. However, for the rebound to continue, both a weakening of crude oil prices and a cooling of the US dollar index are needed simultaneously. At 0:50 Beijing time, spot gold was trading at $4,064.52 per ounce, up 0.38%. COMEX gold is trading at $4,067 per ounce, up 0.41%.
Seasonal positive factors for gold typically begin to emerge in July, with support strengthening further in August. Historically, gold has a higher probability of rising and better average returns during this period. Currently, gold prices have fallen by 30% from their year-to-date high to recent lows, suggesting reasonable room for a technical rebound. It's worth noting that whenever I express a bullish view, online opinions are mostly opposed. As a contrarian trader, I believe this widespread pessimism is precisely a signal for optimism, not a risk warning. Gold Futures Technical Analysis From a weekly chart perspective, gold has fallen by nearly 30% this year, with a clear downward trend. However, in the past four weeks, bears have consistently failed to push gold prices below the $4000 level and sustain their decline. Simultaneously, weekly trading volume for gold has continued to shrink, which is completely inconsistent with the typical volume and price characteristics of a deep bear market. Furthermore, the continued decline in long positions in the gold futures market indicates that this round of price declines is likely just a deep correction within a long-term upward trend, not the beginning of the end of a multi-year bull market. Three weeks ago, gold closed with a bullish hammer candlestick on the weekly chart, and the price has consistently held above the low of that candlestick. As of the close of this week, gold is again forming an inverted hammer pattern near the $4000 level. Until gold makes a decisive breakout or closes firmly below the recent low on the daily chart, a significant rebound remains possible. Crude oil and a strong US dollar remain the biggest headwinds for gold bulls . The core factor currently suppressing a gold rebound is the persistently strong US dollar. However, if tensions in the Middle East gradually ease, the dollar is likely to correct, potentially providing a key driver for a gold rebound. Even so, I remain optimistic about the future trend of the US dollar index, expecting it to further test the 102 level. If this prediction comes true, gold will likely first retest recent lows before initiating the anticipated reversal and rebound. If gold prices break below the current support level, the next key support levels to watch are 3900 (October low), 3776.4 (100-week exponential moving average), and 3680.6 (September volume level). Conversely, if gold prices hold above recent lows, the key resistance levels are 4200 and 4300. With risks escalating over the weekend, the 4000 level has become the market's central focus. (COMEX Gold Daily Chart Source: FX678) Gold prices plunged over 1% on Thursday, marking its worst performance in eight trading days, with short-term market sentiment completely shifting towards the bears. However, the support level of $4,000 remains significant. Most traders are closely watching this level, and institutional portfolio managers are likely to allocate gold to hedge against weekend geopolitical risks, further strengthening the support at this level. The geopolitical risk of a gap-up opening in crude oil prices this weekend could put pressure on market risk sentiment at the start of Monday's trading. However, if institutional funds concentrate on buying gold for hedging, gold prices are expected to hold recent lows, at least avoiding a deep decline. From a purely technical perspective, a pullback to the $4,000 level would likely trigger a small rebound. However, for the rebound to continue, both a weakening of crude oil prices and a cooling of the US dollar index are needed simultaneously. At 0:50 Beijing time, spot gold was trading at $4,064.52 per ounce, up 0.38%. COMEX gold is trading at $4,067 per ounce, up 0.41%.- Risk Warning and Disclaimer
- The market involves risk, and trading may not be suitable for all investors. This article is for reference only and does not constitute personal investment advice, nor does it take into account certain users’ specific investment objectives, financial situation, or other needs. Any investment decisions made based on this information are at your own risk.