Brent crude rose above $100 this week but then fell back. Is this a sign of a pullback to pick up buyers or a retreat signal from the bulls?
2026-07-25 10:37:01
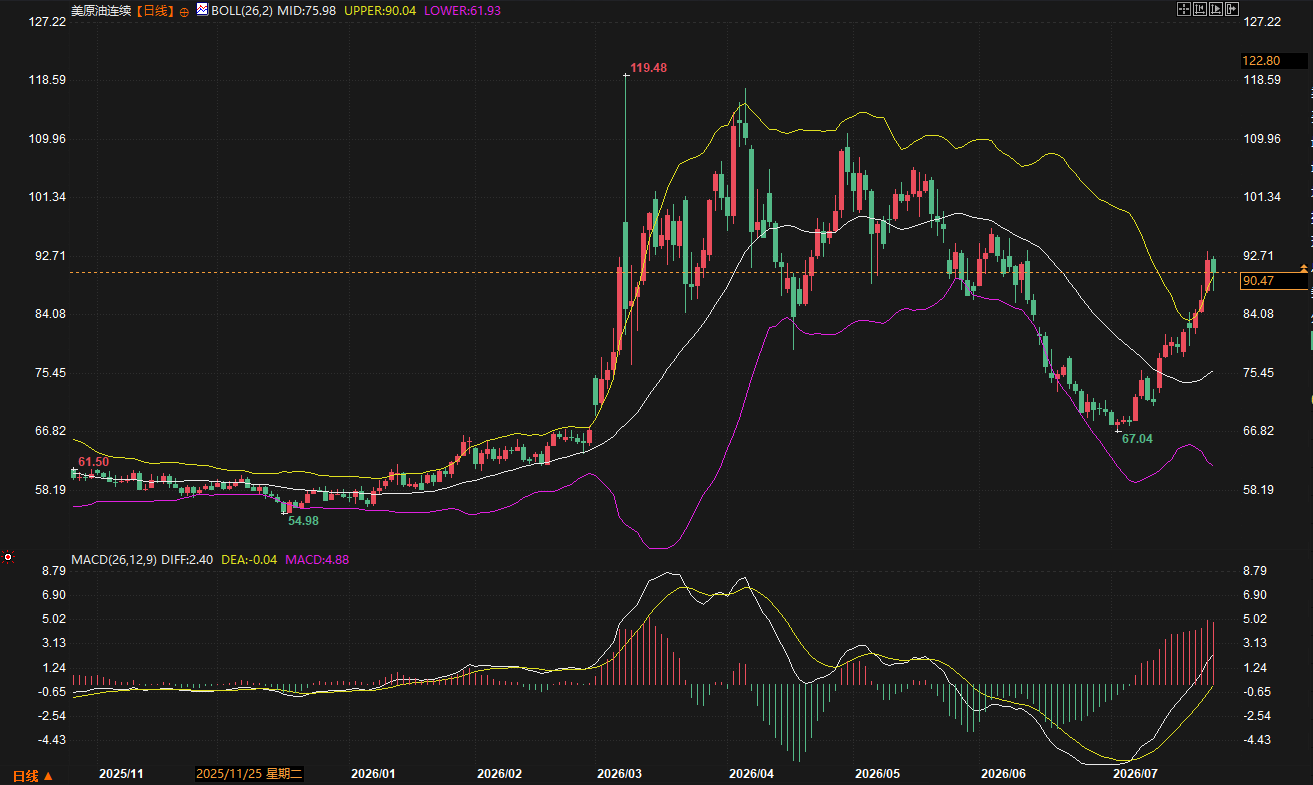
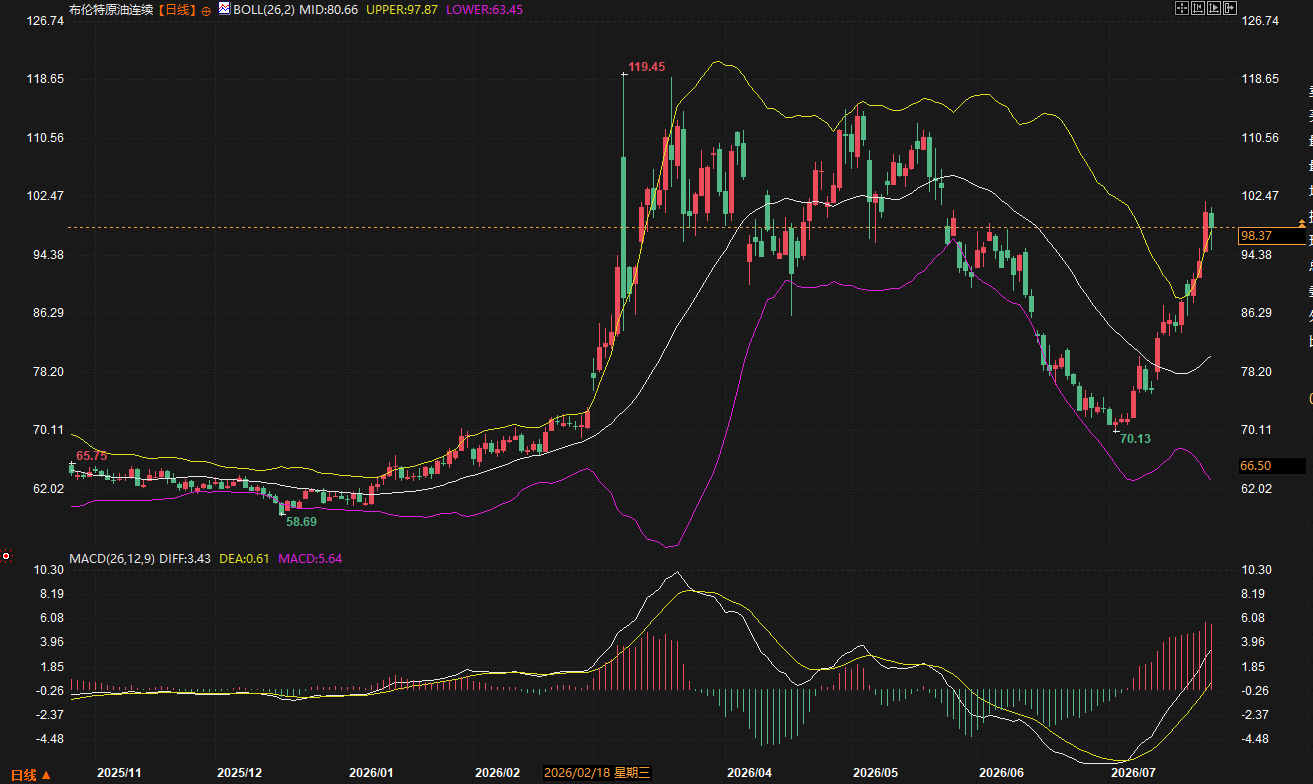
The crude oil market experienced a dramatic emotional rollercoaster this week (July 20-25). At the beginning of the week, news of missile exchanges between the US and Iran and Houthi attacks on oil tankers in the Red Sea pushed Brent crude back above $100 per barrel, with WTI also surging. However, on Friday, news of a potential resumption of US-Iran peace talks instantly extinguished bullish enthusiasm, with both major crude oil benchmarks plunging more than 4% in a single day. Technically, oil prices remain above the upper Bollinger Band, and the MACD golden cross continues to expand, but the fragility of geopolitical premiums was clearly exposed this week. 
Weekly Market Review
WTI crude oil is currently priced at $90.47, up 8.82% this week. Prices climbed steadily from lows at the beginning of the week, briefly breaking through the upper Bollinger Band at $90.04 and entering a strong uptrend. Friday's news-driven price action caused some of these gains to be given back, but the weekly chart still shows a significant positive candle. Brent crude oil is currently priced at $98.37, up 8.54% for the week, also breaking through the upper Bollinger Band at $97.87 before pulling back. From a candlestick chart perspective, the rebound trend of both crude oils from their recent lows continues, but Friday's long bearish candle clearly indicates that the premium built on geopolitical news can be quickly wiped out by a mere rumor of peace talks.Summary of Economic Data and Events
This week, the pricing logic of the crude oil market was almost entirely driven by geopolitics. Midweek, Iran launched missiles at US forces, the Houthi rebels announced a naval blockade of Saudi Arabia, two Saudi oil tankers were attacked in the Red Sea, and US President Trump immediately stated that he would impose "significant military punishment" on Iran and the Houthis. This series of escalating actions briefly pushed Brent crude above $100 per barrel for the first time since May. However, on Friday, major overseas institutions, citing sources, reported that efforts were underway to restart the stalled US-Iran peace talks, causing oil prices to fall by more than 4%. Regarding shipping data, a well-known foreign media outlet, citing Kpler ship tracking data, reported that the number of ships passing through the Strait of Hormuz over the past three days remained at an extremely low level of three per day, but was not completely interrupted. On Thursday, two ships, including an empty Very Large Crude Carrier (VLCC), entered the Persian Gulf through the strait. As for the Bab el-Mandeb Strait, 32 commodity carriers passed through on July 23, up from 26 the previous day, and ships were still passing through as of the 24th. This means that the "full blockade" scenario previously feared by some market participants has not yet materialized.Summary of analyst and institutional views
John Kilduff, a partner at Again Capital, aptly captured Friday's market sentiment. He summarized the plunge in one sentence: "This market loves nothing more than hope." He pointed out that the market clings to any sign that the situation might be resolved, and no one wants to establish directional exposure in a highly uncertain environment. This precisely explains the vulnerability of oil prices to rumors of negotiations. Phil Flynn, senior analyst at Price Futures Group, offered a warning from an inventory perspective. He believes the energy market remains fragile, with overall inventories still tight, and this tightness could change rapidly with a single piece of news; therefore, both supply and demand deserve close attention. A well-known foreign media outlet quoted UBS analyst Giovanni Staunovo for a relatively calm interpretation of shipping data. He pointed out that ships are still sailing where conditions permit, and the actual situation is not the complete blockade feared by some market participants. This assessment corroborates Kpler's tracking data, suggesting that the risk of supply disruptions may have been overpriced. A JP Morgan analyst report, also cited by a well-known foreign media outlet, quantitatively assessed the potential impact of supply disruptions. Their calculations show that for every additional month of supply disruption, Brent crude oil prices will rise by approximately $7 to $8; if the disruption lasts for three months, the average monthly price could rise to around $114 per barrel. This data provides a clear reference point for assessing the reasonable range of geopolitical premiums. This week's crude oil market exposed a structural problem: geopolitical events can push Brent crude to $100 within days, but an unconfirmed report of peace talks can also cause prices to give back most of their gains within hours. Technically, bullish momentum remains strong—the MACD has formed a golden cross, the red bars are expanding, and the price has risen above the upper Bollinger Band—but these technical signals are built on the sandy ground of geopolitical premiums. The core suspense going forward lies in whether the actual navigation situation in the Strait of Hormuz will further deteriorate, and whether peace talks can open a genuine diplomatic channel between the US and Iran. The former determines the upper limit of supply disruptions, while the latter determines the lower limit of risk premiums; oil prices will seek a balance between the two.Frequently Asked Questions
Why did a mere rumor of peace talks cause oil prices to plummet by 4% in a single day? The logic suggests that a substantial geopolitical premium is embedded in current oil prices. When events such as the US-Iran missile exchanges and Houthi attacks on oil tankers occur simultaneously, the market quickly prices in the risk of supply disruptions. Once a signal of peace talks emerges—even a preliminary probe—this premium is squeezed out almost immediately. A partner at Again Capital succinctly summarizes this: the market loves hope. In the illiquid summer, price volatility caused by shifts in sentiment often outweighs changes in fundamentals. Is the Strait of Hormuz actually blocked? Kpler's ship tracking data suggests "partially restricted, but not completely blocked." An average of three ships per day have passed through the Strait of Hormuz over the past three days, a very low number, while twenty to thirty ships are still passing through the Bab el-Mandeb Strait. UBS analysts' views are worth considering: ships are still sailing when conditions permit; a complete blockade has not yet materialized. This means the market is currently pricing in "serious disruption" rather than "complete cutoff." Technical indicators show strong bullish momentum, so why be wary of a pullback? Both WTI and Brent crude oil broke through the upper Bollinger Band, with the MACD showing a golden cross and expanding red bars, indicating a bullish short-term trend. However, the price's continuous trading above the upper band is itself an overbought signal that warrants attention, and Friday's sharp drop revealed this technical vulnerability. In strong markets, pullbacks are often rapid and significant; whether the price can subsequently regain its footing above the upper band is a crucial indicator of the bullish momentum. What does JP Morgan's target price of $114 mean? This number should not be interpreted as a price prediction. It's a scenario projection: assuming a supply disruption lasts three months, the monthly average price could rise to around $114. The real value of this projection lies in providing a table of geopolitical premiums and their correlation with time—a one-month disruption corresponds to a $7-8 increase, allowing the market to adjust its expectations based on the actual duration of the disruption. What is the main contradiction in the current oil market? The core contradiction is the tug-of-war between geopolitical supply concerns and negotiations. The former provides upward momentum, while the latter could extinguish the gains at any time. Furthermore, the overall tight inventory fundamentals have given bulls some confidence, but the potential backlash from geopolitical events on global economic growth and oil demand constitutes an invisible ceiling on prices. The key variable for each trading day going forward will most likely remain the ship traffic data in the Strait of Hormuz and the Bab el-Mandeb Strait.- Risk Warning and Disclaimer
- The market involves risk, and trading may not be suitable for all investors. This article is for reference only and does not constitute personal investment advice, nor does it take into account certain users’ specific investment objectives, financial situation, or other needs. Any investment decisions made based on this information are at your own risk.