Ahead of the Fed's decision, the battle between gold bulls and bears had shifted to this indicator.
2026-07-27 15:40:02
On Monday, July 27, spot gold rebounded to around $4,100 per ounce after falling in the previous trading day, a gain of about 1.2%. During the same period, the US dollar index fell by about 0.3%, international oil prices fell by more than 5%, and interest rate futures indicated a probability of about 65.7% that the Federal Reserve would maintain interest rates at its July meeting. Gold's current performance is not driven solely by a safe-haven logic, but is simultaneously influenced by nominal interest rates, energy inflation, dollar liquidity, and the repricing of risk premiums related to the Middle East situation. 
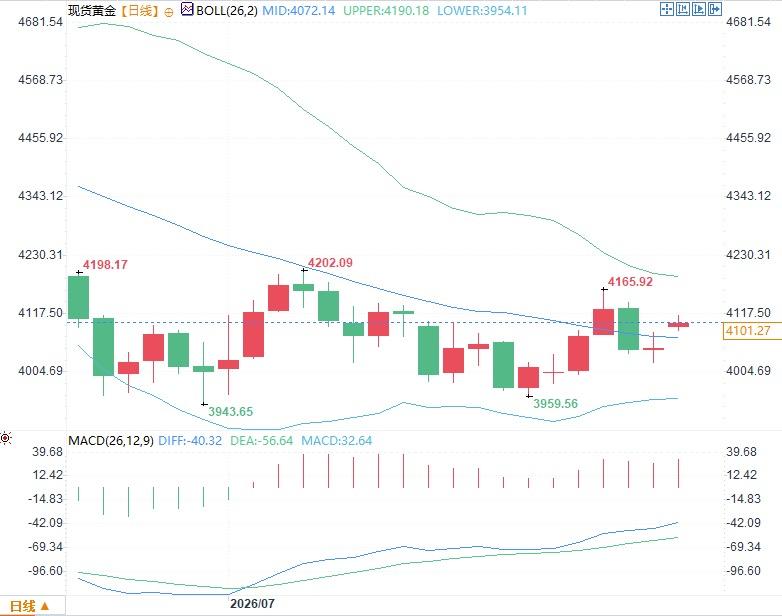 In the MACD indicator, the DIFF is -40.32, the DEA is -56.64, and the histogram has rebounded to 32.64. The DIFF remains below the zero line, indicating that the medium-term trend has not yet fully reversed from weak to strong; however, the DIFF crossing above the DEA and the histogram expanding show that short-term corrective momentum is strengthening. This combination typically corresponds to a rebound confirmation phase in a downtrend, rather than a confirmation phase of a complete uptrend. The key to the market structure lies in whether the area around $4070 can become effective support. This area is close to the Bollinger Band middle line and is also a densely traded area of recent daily candlesticks. The $4190 to $4202 range above includes both the Bollinger Band upper line and previous highs. If the price cannot digest the selling pressure in this area, the daily chart may still maintain a wide consolidation range of $3950 to $4200. From a volatility perspective, the Fed meeting and Middle East news will affect the dollar, oil prices, and yields within the same time window. Gold faces not a simple directional choice, but rather a potential sudden shift in the correlation between related assets. After the meeting statement is released, if nominal yields and the US dollar fluctuate in the same direction, gold prices are usually more volatile; if they move in opposite directions, the market is more likely to see a surge followed by a decline or a bottoming out and rebound.
Falling oil prices alter the macro pricing structure of gold
The key to the recent gold rebound is not the continued rise in safe-haven demand, but rather the simultaneous cooling of market expectations for inflation and monetary policy following the rapid decline in oil prices. Brent crude fell to $90 per barrel, and US crude fell to $83 per barrel. Lower energy prices mean a reduction in the tail risk of short-term inflation, weakening the bond market's pricing of an immediate Fed rate hike, leading to a decline in long-term yields and a marginal improvement in the cost of holding gold. This transmission chain needs to be analyzed in detail. While falling oil prices weaken some safe-haven buying, they also reduce the pressure on nominal and real interest rates to continue rising. For gold, which does not generate interest income, the latter factor is usually more sustainable. Therefore, the fact that gold can rebound despite the easing of tensions in the Middle East indicates that current price elasticity has shifted from being driven solely by geopolitical risks to being driven by both real interest rates and the US dollar. However, if oil prices continue to decline, it may also reduce the urgency for inflation-hedging funds to allocate to gold. Gold is therefore in a structural tug-of-war: declining safe-haven premiums provide resistance, while cooling interest rate expectations provide support. The price rebound is not yet sufficient to prove that the trend has reversed.The core of the Federal Reserve meeting is not the interest rate outcome, but the reaction function.
The Federal Reserve will hold its policy meeting on July 28-29, and announce its interest rate decision on the 29th. The June meeting maintained the federal funds target range at 3.50% to 3.75%, and the market benchmark expectation remains unchanged. However, the probability of a rate hike has increased significantly since the beginning of the month, indicating that traders are wary of tail risks in policy. What gold really needs to price is not the static outcome of "rate hike or no rate hike," but how the Fed explains the relationship between energy prices, inflation stickiness, and economic activity. If the statement emphasizes that the recent oil price shock is temporary and believes that current interest rates are sufficient to constrain demand, the market may lower its expectations for future rate hikes, and gold's support will mainly come from a decline in the yield curve. If the statement leaves room for further tightening, even if interest rates remain unchanged, short-term interest rates and real yields may still rise, limiting the gold rebound. It is worth noting that interest rate futures estimates for a July rate hike recently rose to nearly 40%, before cooling as oil prices fell. This indicates that current policy expectations are highly sensitive to the energy market, and also means that post-meeting pricing may see significant corrections.The technical structure suggests a rebound is underway, but the breakout has not yet been confirmed.
The daily chart shows that the latest spot gold price is around $4100/oz, with the Bollinger Band middle line at $4072.14/oz, the upper line at $4190.18/oz, and the lower line at $3954.11/oz. The price rebounded from around $3959.56 and has now climbed back above the middle line, indicating that the previous downward momentum has clearly weakened, but it has not yet effectively broken through the dense resistance zone formed by $4165.92 and $4202.09. In the MACD indicator, the DIFF is -40.32, the DEA is -56.64, and the histogram has rebounded to 32.64. The DIFF remains below the zero line, indicating that the medium-term trend has not yet fully reversed from weak to strong; however, the DIFF crossing above the DEA and the histogram expanding show that short-term corrective momentum is strengthening. This combination typically corresponds to a rebound confirmation phase in a downtrend, rather than a confirmation phase of a complete uptrend. The key to the market structure lies in whether the area around $4070 can become effective support. This area is close to the Bollinger Band middle line and is also a densely traded area of recent daily candlesticks. The $4190 to $4202 range above includes both the Bollinger Band upper line and previous highs. If the price cannot digest the selling pressure in this area, the daily chart may still maintain a wide consolidation range of $3950 to $4200. From a volatility perspective, the Fed meeting and Middle East news will affect the dollar, oil prices, and yields within the same time window. Gold faces not a simple directional choice, but rather a potential sudden shift in the correlation between related assets. After the meeting statement is released, if nominal yields and the US dollar fluctuate in the same direction, gold prices are usually more volatile; if they move in opposite directions, the market is more likely to see a surge followed by a decline or a bottoming out and rebound.
- Risk Warning and Disclaimer
- The market involves risk, and trading may not be suitable for all investors. This article is for reference only and does not constitute personal investment advice, nor does it take into account certain users’ specific investment objectives, financial situation, or other needs. Any investment decisions made based on this information are at your own risk.