The probability of an interest rate hike has risen to 36%, but silver bulls are not most worried about interest rate decisions.
2026-07-28 21:00:05
On Tuesday, July 28th, spot silver traded around $57.30 per ounce, down approximately 1.7% on the day. The rebound at the beginning of the week, driven by easing regional tensions, failed to continue, as funds readjusted their exposure to precious metals ahead of the Federal Reserve's decision. After more than ten days of operations, the US suspended further strikes, and Iran stated that it would continue to halt retaliatory actions as long as the pause remained in place. Expectations of de-escalation pushed Brent crude oil back down to around $84 per barrel. The decline in energy risk premiums should have alleviated concerns about imported inflation, but silver failed to receive sustained support, indicating that the current price driver has shifted from simple safe-haven demand to the repricing of monetary policy. 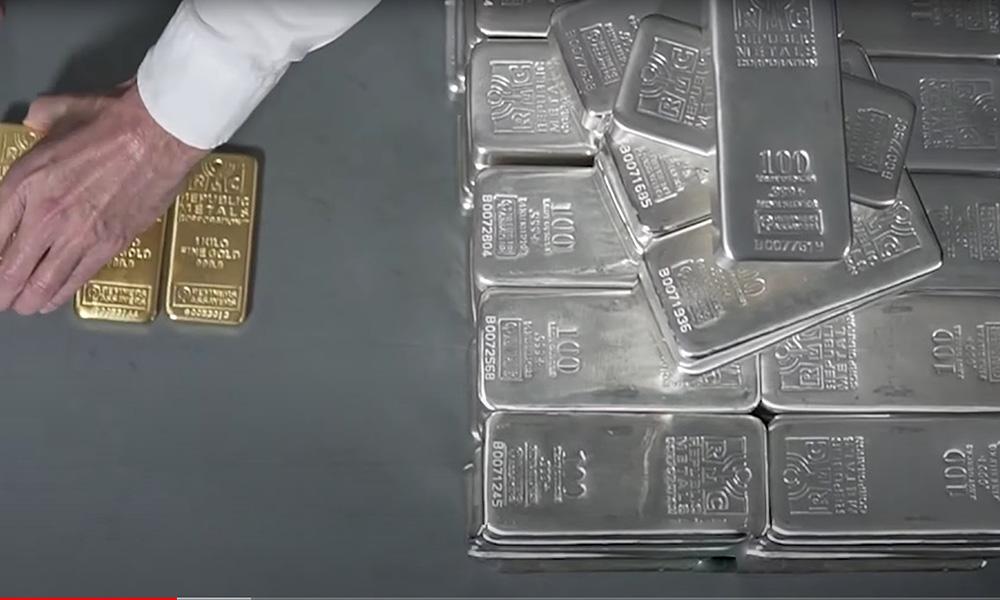
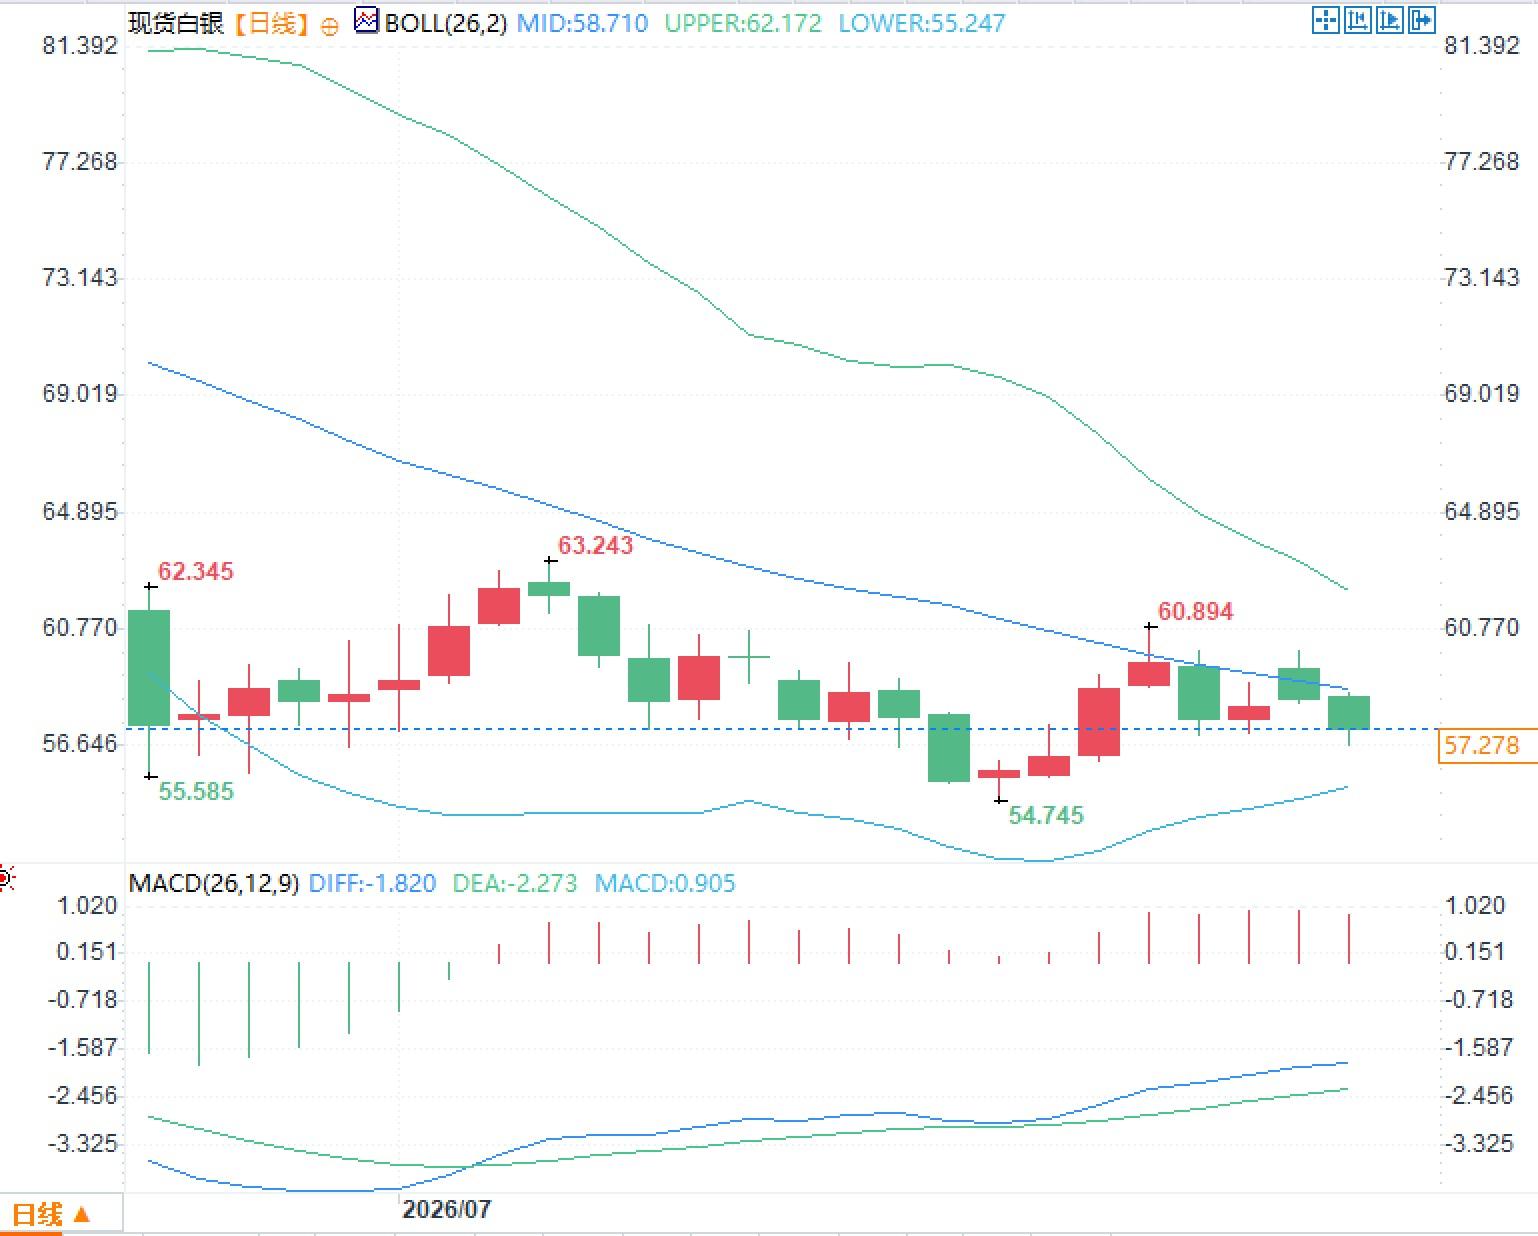 On the downside, we need to pay attention to the lower Bollinger Band around $55.247 and the previous low of $54.745 shown in the chart. These two constitute a volatility support zone, rather than a single static point. On the upside, we face the middle Bollinger Band at $58.710, the local high at $60.894, and the upper Bollinger Band at $62.172. Only when the price re-enters above the middle Bollinger Band can the Bollinger Band structure change from a one-sided downward slope to a sideways convergence. Regarding the MACD, the fast line is at -1.820, the slow line is at -2.273, and the histogram value is 0.905. Both lines are still below the zero axis, indicating that the medium-term trend has not yet completed its recovery; however, the fast line is now above the slow line, and the positive histogram continues, indicating that the downward momentum has weakened compared to before. The weakening price coupled with the improving MACD histogram reflects a coexistence of a bearish trend and a marginal recovery in momentum. The Fed's decision, oil prices, and regional situations will determine whether this recovery can translate into an improvement in the price structure.
Why are prices weakening? Safe-haven appeal gives way to interest rate sensitivity.
Silver possesses attributes of both precious and industrial metals. During periods of regional tension, safe-haven flows, inflation trading, and rising energy prices can resonate; once the situation eases, these three chains of logic weaken simultaneously. The sharp drop in crude oil prices reduced short-term inflation compensation demand and also weakened the event premium in precious metal holdings, leading some funds to cash out early. However, this round of decline cannot be simply attributed to a ceasefire. If the market only trades on a de-escalation, gold, silver, and crude oil typically exhibit a clearer synchronous relationship. The current pattern of silver rising first and then falling, breaking below $58 before the Fed meeting, is more consistent with the characteristics of institutions reducing overnight exposure, option market makers adjusting hedging, and trend funds reassessing the real interest rate path. Previously, silver experienced significant volatility; on July 27, the settlement price of silver futures was $58.472 per ounce, down 0.31% from the previous trading day, but still up nearly 60% year-on-year. This high year-on-year increase means the market is not lacking in medium- to long-term bullish narratives; the real question is how much of the expectation of policy easing, supply constraints, and industrial demand has already been priced into valuations. The higher the price, the more drastic the position adjustment tends to be when there are marginal changes in macroeconomic variables.Fed Decision: The risk lies not in whether to maintain interest rates, but in changes to the policy function.
The Federal Reserve's July meeting will be held from July 28th to 29th, with the interest rate decision to be announced on the 29th. The current target range for the federal funds rate is 3.50% to 3.75%, and the market consensus remains that it will remain unchanged. However, interest rate futures once reflected a probability of about 36% for this rate hike, indicating a significant widening of the divergence. The June meeting statement pointed out that inflation remains above the 2% target, and supply shocks, such as those in the energy sector, are pushing up prices in some areas. Chairman Warsh recently stated that inflation has been above the target for an extended period, and policymaking needs to reaffirm the credibility of price stability. The focus of their communication is not on promising a fixed number of rate hikes, but rather on observing whether the monthly increase in inflation becomes sustainable. Therefore, the impact of this meeting on silver cannot be judged solely by whether the interest rate remains unchanged. More crucially, it is whether the statement strengthens its focus on energy shocks, inflation contagion, and financial conditions, and whether there are dissenting votes supporting a rate hike. Even if the policy rate remains unchanged, as long as the market believes that the Fed's response function has shifted from waiting for data to preventing double-dip inflation, real interest rate expectations may still rise, constraining the valuation of non-interest-bearing assets. Conversely, if the meeting does not release any tightening signals beyond expectations, and the decline in oil prices reduces recent inflationary pressures, some of the losses in silver caused by hedging may be repriced. However, this is a correction of the risk premium and does not mean that the medium-term trend has reversed.Technical Structure: The trend remains weak, but momentum has shown signs of localized recovery.
The daily Bollinger Bands show the middle band at $58.710, the upper band at $62.172, and the lower band at $55.247. The current price remains below the middle band, indicating that it has not yet escaped its weak trading range. The continued downward sloping of the middle band and the simultaneous decline of the upper band reflect the continued downward pressure from the previous highs. The area around $58.7 has transformed from a typical moving average level into a short-term price support/resistance level. On the downside, we need to pay attention to the lower Bollinger Band around $55.247 and the previous low of $54.745 shown in the chart. These two constitute a volatility support zone, rather than a single static point. On the upside, we face the middle Bollinger Band at $58.710, the local high at $60.894, and the upper Bollinger Band at $62.172. Only when the price re-enters above the middle Bollinger Band can the Bollinger Band structure change from a one-sided downward slope to a sideways convergence. Regarding the MACD, the fast line is at -1.820, the slow line is at -2.273, and the histogram value is 0.905. Both lines are still below the zero axis, indicating that the medium-term trend has not yet completed its recovery; however, the fast line is now above the slow line, and the positive histogram continues, indicating that the downward momentum has weakened compared to before. The weakening price coupled with the improving MACD histogram reflects a coexistence of a bearish trend and a marginal recovery in momentum. The Fed's decision, oil prices, and regional situations will determine whether this recovery can translate into an improvement in the price structure.
- Risk Warning and Disclaimer
- The market involves risk, and trading may not be suitable for all investors. This article is for reference only and does not constitute personal investment advice, nor does it take into account certain users’ specific investment objectives, financial situation, or other needs. Any investment decisions made based on this information are at your own risk.