With the 50% tariff countdown underway, why has the USD/CAD pair failed to break through 1.42?
2026-07-29 20:00:50
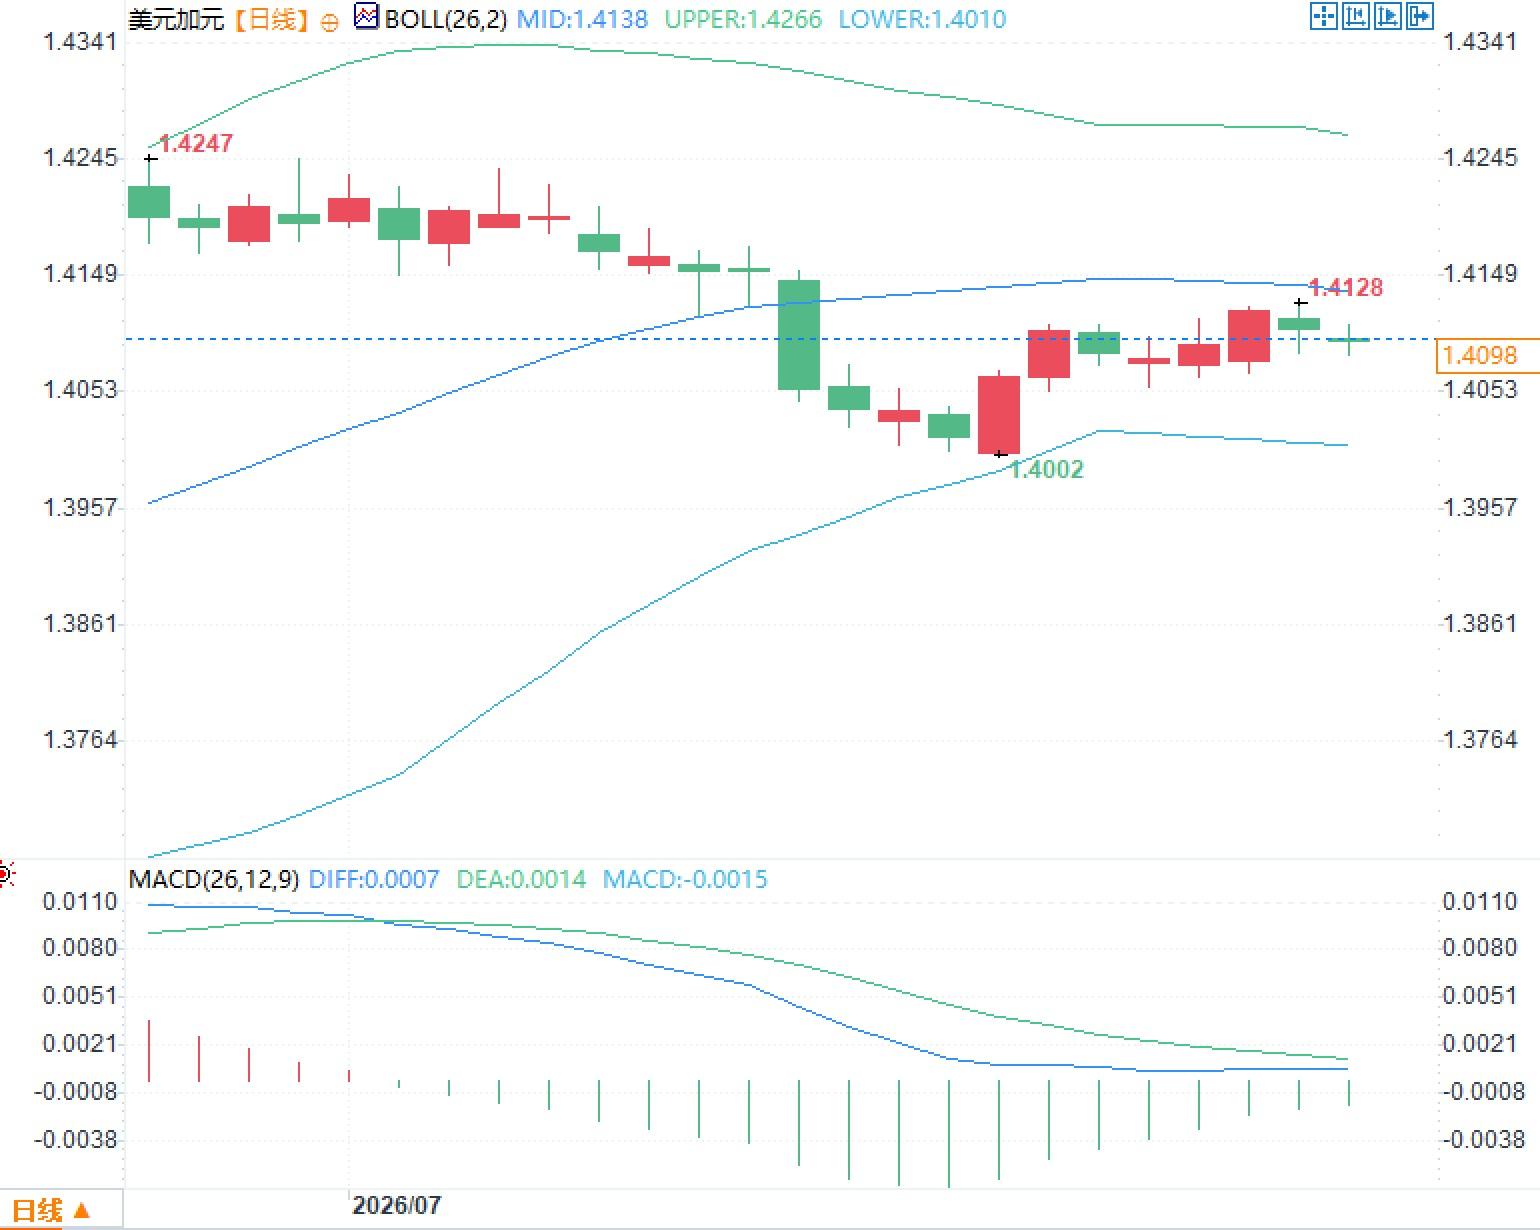
On Wednesday, July 29, the USD/CAD pair traded around 1.4100, a slight pullback from the previous trading day's high of 1.4128, but still within the upper part of its recent range. Tariff expectations, interest rate differentials, and oil price volatility are collectively limiting the Canadian dollar's upside potential. 
 Therefore, the current structure is more akin to an event-driven market within a high-volatility range, rather than a one-sided market that has already chosen a direction. Negotiation news may affect short-term risk premiums, interest rate differentials determine medium-term funding costs, and oil prices amplify or buffer volatility. Only when these three variables change in the same direction will the exchange rate more easily break out of the main trading range of 1.40 to 1.43.
With the tariff deadline approaching, currency trading negotiations have begun.
The core pricing variable for the USD/CAD exchange rate has shifted from general trade frictions to the specific date of August 19th. The US plans to impose an additional 50% tariff on approximately $20 billion worth of Canadian goods under Section 338 of the Tariff Act of 1930, covering dairy products, automotive-related goods, alcoholic beverages, cement, and some consumer goods. In principle, these measures may apply regardless of whether the goods comply with the North American Trade Agreement (NATA) rules of origin, but energy, potash, some key minerals, and goods already subject to other provisions are excluded. This amount represents about 5% of Canada's annual merchandise exports to the US. While the direct impact on overall growth may not be enough to cause a systemic recession, it will significantly alter profit distribution in the automotive, food processing, building materials, and provincial alcoholic beverage sectors. More importantly, Section 338 has almost no prior history of actual enforcement, making it difficult for the market to judge exemption conditions, scope of enforcement, and negotiation withdrawal mechanisms based on historical cases. Therefore, the risk premium is higher than what can be explained by the sheer amount of trade. Dominic LeBlanc, Canada's Minister of Trade with the United States, and chief negotiator Janice Charrett are traveling to Washington to discuss whether the measures can be postponed, scaled back, or converted into a quota arrangement, which will directly affect exchange rate volatility.The pressure on the Canadian dollar stems from the combined effects of tariff risks and interest rate disadvantages.
Following the announcement of the tariffs, the USD/CAD pair rose to around 1.4247, a roughly 14-month high. Simultaneously, net speculative short positions in the Canadian dollar expanded to $12.5 billion, making it one of the most concentrated short positions among major currencies. This indicates that the market is not merely trading on the tariffs themselves, but rather on a combination of risks: declining export profits, delayed corporate investment, increased fiscal response costs, and limited policy space for the Bank of Canada. Interest rate differentials are the second key pricing driver. On July 15th, the Bank of Canada maintained its overnight rate at 2.25%, while the Federal Reserve's most recently announced target range for the federal funds rate was 3.50% to 3.75%, a difference of approximately 1.4 percentage points. The yield spread between Canadian two-year bonds and their corresponding US Treasury yields widened to approximately 144.5 basis points, a relatively high level since May 2025. As long as this interest rate differential does not narrow significantly, there is likely to be demand for US dollars when the USD/CAD pair falls. The Bank of Canada's latest report lowered its 2026 GDP growth forecast to around 0.7%, citing weaker-than-expected growth at the start of the year. First-quarter real GDP was flat compared to the previous quarter, following a 0.2% decline, indicating limited economic resilience. Although the year-on-year growth rate of the Consumer Price Index (CPI) slowed to 2.8% in June from 3.2%, providing some policy leeway, supply chain costs from tariffs and exchange rate transmission make it difficult for monetary policy to respond solely to weak demand.Oil prices are no longer providing stable support, and the technical structure remains range-bound.
The Canadian dollar typically correlates positively with crude oil prices, but recently the support from oil prices for the exchange rate has been noticeably unstable. Crude oil prices previously fell 7.2% in a single day to around US$82.85 per barrel, causing the USD/CAD exchange rate to rise to 1.4115; subsequently, fluctuations in oil prices and risk aversion caused the exchange rate to switch back and forth between 1.40 and 1.42. Energy exports can buffer some of the trade shocks, but are insufficient to offset the pressure from manufacturing tariffs, widening interest rate differentials, and short positions. From a daily chart perspective, the Bollinger Band middle line around 1.4138 forms a short-term support/resistance level, 1.4128 is the latest local high, and 1.4247 to 1.4266 corresponds to the previous high and the upper Bollinger Band area. Below, around 1.4053 is a recent area of high trading volume, and 1.4002 to 1.4010 constitutes a stage low and the lower Bollinger Band area. The MACD fast line remains below the slow line, and although the negative bars show signs of narrowing, this is not yet sufficient to confirm a trend reversal. Therefore, the current structure is more akin to an event-driven market within a high-volatility range, rather than a one-sided market that has already chosen a direction. Negotiation news may affect short-term risk premiums, interest rate differentials determine medium-term funding costs, and oil prices amplify or buffer volatility. Only when these three variables change in the same direction will the exchange rate more easily break out of the main trading range of 1.40 to 1.43.
- Risk Warning and Disclaimer
- The market involves risk, and trading may not be suitable for all investors. This article is for reference only and does not constitute personal investment advice, nor does it take into account certain users’ specific investment objectives, financial situation, or other needs. Any investment decisions made based on this information are at your own risk.