Natural gas prices surged by over 36%; how long can the Eurozone's growth resilience last?
2026-07-30 19:58:53
On Thursday, July 30th, the Eurozone's second-quarter economic growth significantly exceeded market expectations, but the euro did not strengthen accordingly. The euro is currently trading around 1.1465 against the US dollar, still constrained by the upper Bollinger Band at 1.1473 and the previous high of 1.1482-1.1483. Strong growth, the energy shock, and interest rate expectations in Europe and the US are creating a new pricing contradiction. Market focus has shifted from whether an economic recession is imminent to whether the European Central Bank needs to use higher interest rates to suppress the secondary transmission of energy prices. 
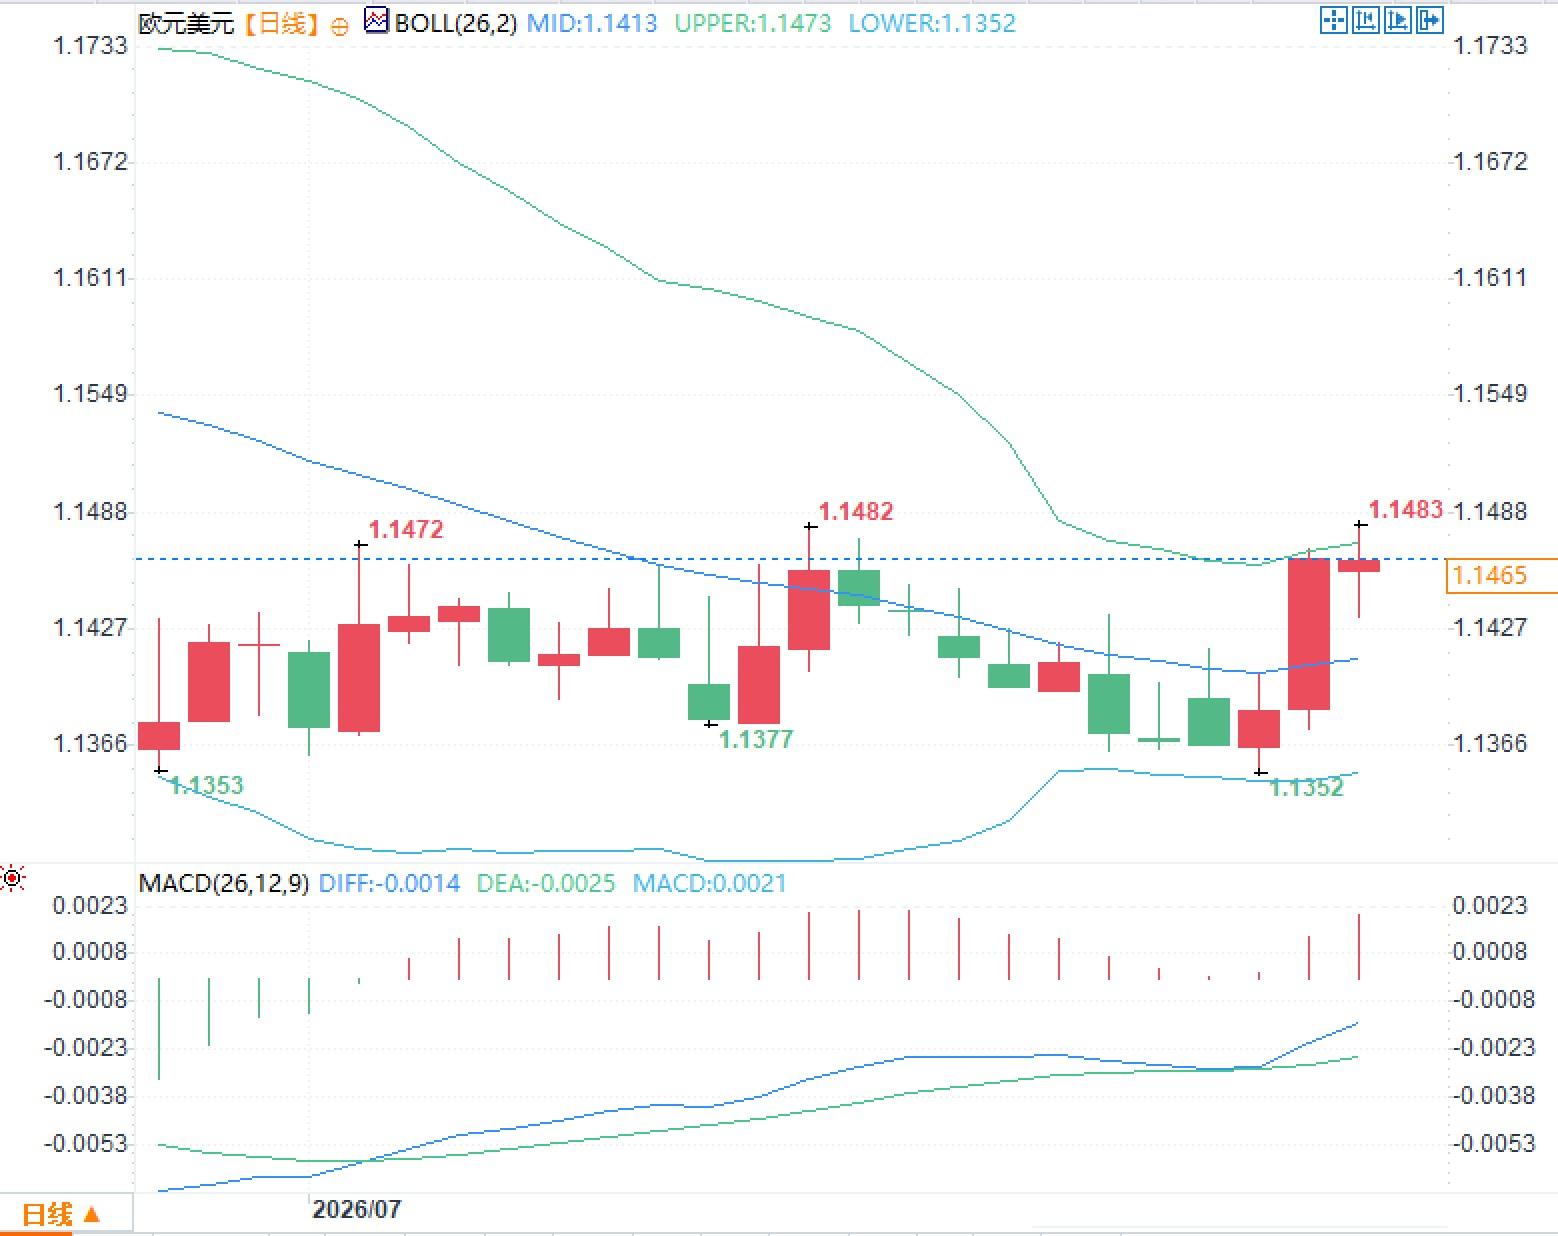 The MACD histogram has turned positive, with the DIFF at -0.0014 and the DEA at -0.0025, indicating improved short-term momentum. However, both indicator lines remain below the zero line. This does not mean the trend has completely reversed, but rather that the previous downward momentum is weakening. If the price continues to trade above the Bollinger Band's middle line, market focus will shift further to the 1.1480 to 1.1500 area.
Growth exceeded expectations, but why was the exchange rate reaction limited?
The Eurozone's seasonally adjusted GDP grew 0.4% quarter-on-quarter in the second quarter, higher than the zero growth in the first quarter; and 1.0% year-on-year, a significant acceleration from 0.5% in the first quarter. During the same period, the EU economy grew 0.5% quarter-on-quarter and 1.2% year-on-year. These figures indicate that despite rising energy costs, unstable external demand, and tight financing conditions, the Eurozone economy continued to expand, and the market's previous assessment that energy shocks would quickly crush growth needs to be revised. It should be noted that this data is a preliminary report, and the basic data is not yet complete; further adjustments may be necessary. The labor market also showed no significant easing. The Eurozone unemployment rate in June was 6.3%, unchanged from the previous month and the same period last year, with approximately 11.13 million unemployed. Stable employment means that household income and service consumption remain supported, but it also means that wages and service prices may remain sticky. For the interest rate market, the 0.4% quarterly growth is not just a statistical surprise, but rather a reduction in the short-term economic costs for the European Central Bank to maintain its restrictive policies. The euro's limited reaction stems primarily from the fact that the foreign exchange market trades not just on single growth figures, but on a combination of future interest rate differentials, energy trade terms, and safe-haven flows. While cautious signals from the Federal Reserve meeting initially lowered global interest rate expectations, escalating conflicts in the Middle East drove funds back to dollar assets. Consequently, positive growth news was partially offset by energy risks and safe-haven demand, leaving the euro fluctuating only below the 1.15 level against the dollar.The European Central Bank's dilemma has shifted from growth to inflation transmission.
The European Central Bank (ECB) maintained its deposit facility rate, main refinancing rate, and marginal lending rate at 2.25%, 2.40%, and 2.65% respectively at its July meeting. On the surface, policy remains in an observation phase, but the release of growth data has shifted the threshold for further rate hikes. Increased economic resilience has shifted policy discussions away from whether rate hikes will trigger a recession, and towards whether energy inflation will spread to transportation, industrial goods, service prices, and wage negotiations. In June, Eurozone headline inflation fell to 2.8% from 3.2% in May, while inflation excluding energy and food fell to 2.4% from 2.6%, and services inflation also declined to 3.2% from 3.5%. While the data direction has improved, energy prices still rose by 8.5% year-on-year. This means that the decline in headline inflation has not eliminated the energy risk, but only temporarily slowed the impact. If high energy prices persist for a longer period, companies may raise prices to protect profit margins, subsequently leading to broader indirect inflation. Therefore, the key to the September policy meeting is not simply comparing the difference between 2.8% and 2%, but rather assessing the duration of the energy shock, corporate pricing behavior, and whether inflation expectations have risen again. Second-quarter growth reached 0.4%, which objectively reinforced the argument for a tighter policy stance, but preliminary data may be revised, and the ECB will still avoid drawing conclusions based solely on a single growth report.Natural gas deserves more attention in the foreign exchange market than crude oil.
As of July 30, the benchmark price of natural gas in Europe was approximately €58.54 per megawatt-hour. Although it fell 3.35% that day, it had still risen by about 36.08% over the past month and was about 65.92% higher than the same period last year. Previously, the price had approached €60 per megawatt-hour, reaching multi-year highs. The magnitude and persistence of the natural gas price increase are putting pressure on the Eurozone's terms of trade, industrial profit margins, and winter storage costs. Crude oil prices, after a significant increase earlier, have fallen back below $90 per barrel. While tanker shipping has not been completely disrupted, temporarily easing extreme supply risks, price volatility remains high. For the Eurozone, rising imported energy prices will increase nominal import expenditures, and even if real growth remains resilient, it could weaken the euro's fundamentals through deteriorating terms of trade. The impact of natural gas is particularly complex. It not only affects residential heating but also directly impacts marginal electricity costs, chemicals, glass, fertilizers, and metal processing industries. The longer the high natural gas prices persist, the more likely improvements in growth data will be accompanied by compressed profit margins and increased inflation stickiness. The market therefore did not simply interpret the 0.4% growth as a one-sided positive for the euro, but rather as a signal that the European Central Bank is more capable of maintaining high interest rates, but also less able to quickly escape energy constraints.The euro has entered a zone of convergence between policy and technical factors against the US dollar.
The daily chart shows that the euro has rebounded sharply against the US dollar from around 1.1352, with the latest price rising to around 1.1465, regaining the middle Bollinger Band at 1.1413. The upper Bollinger Band is located at 1.1473, which highly coincides with the recent highs of 1.1482 to 1.1483, forming a clear dense pricing zone. This area is not only a technical resistance level but also a key point for the market to reassess European growth and the interest rate differential between Europe and the US. The MACD histogram has turned positive, with the DIFF at -0.0014 and the DEA at -0.0025, indicating improved short-term momentum. However, both indicator lines remain below the zero line. This does not mean the trend has completely reversed, but rather that the previous downward momentum is weakening. If the price continues to trade above the Bollinger Band's middle line, market focus will shift further to the 1.1480 to 1.1500 area.
- Risk Warning and Disclaimer
- The market involves risk, and trading may not be suitable for all investors. This article is for reference only and does not constitute personal investment advice, nor does it take into account certain users’ specific investment objectives, financial situation, or other needs. Any investment decisions made based on this information are at your own risk.