With economic growth slowing to 1.5%, is the pressure on the dollar only just beginning?
2026-07-30 21:14:51
On Thursday, July 30th, the US dollar index fell back to around 100.70 after a flurry of US macroeconomic data releases, down about 0.1% on the day. The latest data presented a clear combination of characteristics: overall inflation cooled due to falling energy prices, while core inflation remained above the Federal Reserve's target; second-quarter economic growth was lower than expected, but the job market had not yet shown significant deterioration. The market is not facing a single easing signal, but rather a complex situation of slowing growth, sticky inflation, and resilient employment coexisting. 
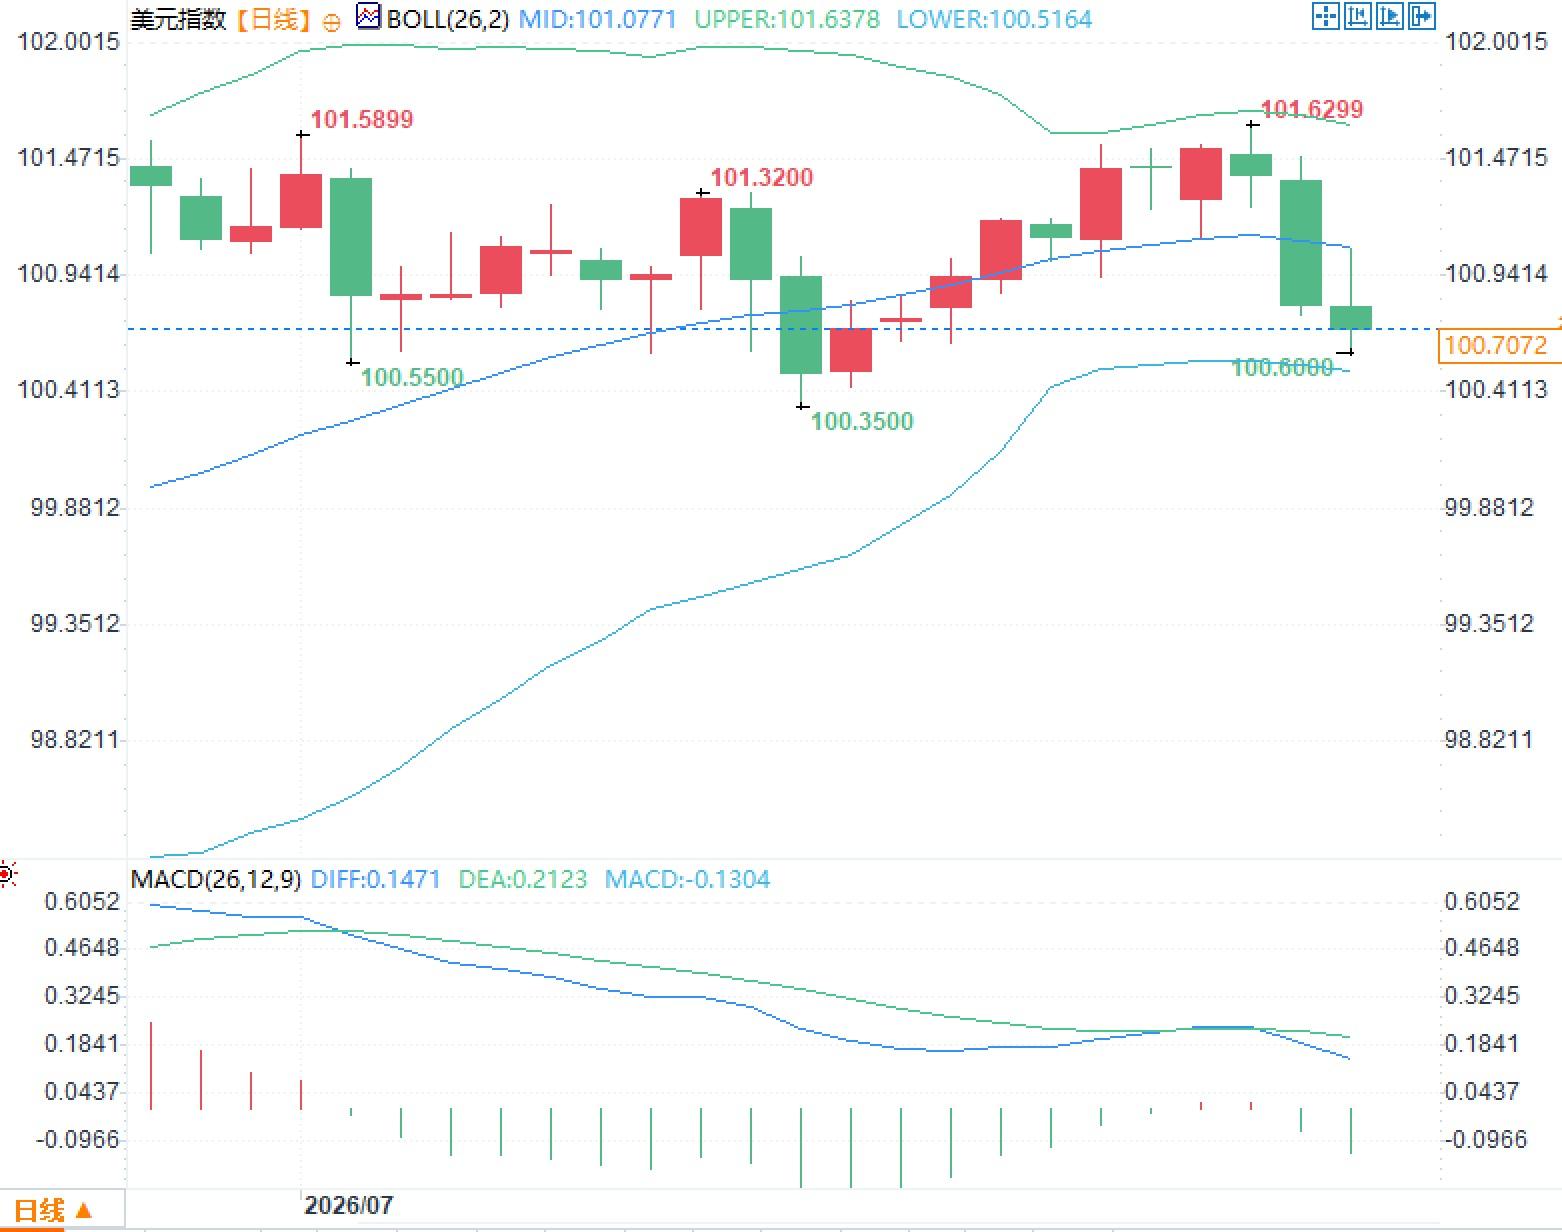 However, the dollar's pullback does not equate to a complete reversal of macroeconomic logic. Declining overall inflation and slower-than-expected economic growth have lowered expectations for rising interest rates, creating short-term pressure; while high core inflation and stable employment data limit the scope for a rapid decline in interest rates. Meanwhile, long-term Treasury yields remain high, with the 30-year yield reaching 5.240% at one point, reflecting market concerns about long-term inflation, fiscal supply, and term premiums. Therefore, the area around 100.50 not only represents the lower Bollinger Band in the technical chart but also corresponds to a rebalancing zone in market expectations regarding Federal Reserve policy. The dominant factors driving future dollar fluctuations will be the relative strength of core service sector inflation, employment growth, income changes, and long-term yields.
Inflation has declined, but structural pressures have not disappeared.
The personal consumption expenditures (PCE) price index fell 0.1% month-on-month in June, marking the first monthly negative growth since 2020, with the year-on-year increase decreasing from 4.1% to 3.7%. The core PCE price index rose 0.1% month-on-month, and the year-on-year increase fell from 3.4% to 3.3%. The core month-on-month increase was lower than the market's previous expectation of 0.2%, but the year-on-year level of 3.3% is still significantly higher than the Federal Reserve's long-term target of 2%. The key to this round of overall inflation slowdown came from the goods side. Goods prices fell 0.6% in June, while the month-on-month increase in service prices slowed to 0.1% from 0.5% in May. This means that the short-term cooling of inflation was mainly driven by energy and some commodity prices, and cannot be simply interpreted as a simultaneous disappearance of all price pressures. For monetary policy, while lower energy prices can quickly reduce the overall index, they may not be able to sustainably change housing, healthcare, insurance, and other service prices. As long as core inflation remains above 3%, the Federal Reserve lacks sufficient conditions to quickly shift to easing. Therefore, the market is lowering its assessment of the urgency of further tightening, rather than immediately confirming a sustained rate-cutting cycle.With economic growth slowing, the quality of consumption is more important than the quantity.
The annualized GDP growth rate in the second quarter was 1.5%, significantly lower than the 2.1% in the first quarter and also lower than the market expectation of 2.1%. Consumption, investment, and exports continued to contribute positively, but declining government spending, slower growth in investment and exports, and increased imports dragged down the overall GDP. Personal consumption expenditure in June increased by 0.3% month-on-month, a significant slowdown from the revised 0.9% in May; real consumption expenditure, after price adjustments, increased by 0.4%. Nominal consumption increased by only $65.2 billion, of which service consumption increased by $58.2 billion and goods consumption increased by only $7 billion. Spending on energy goods decreased by $48.1 billion, while spending on healthcare, financial insurance, and transportation services continued to increase. This structure indicates that consumption did not contract across the board, but rather changed under the influence of price declines and a redistribution of spending. Real consumption still grew, but nominal income growth was only 0.2%, lower than the expected 0.3% and significantly weaker than May's 0.7%. If income growth continues to lag behind consumption, subsequent consumption expansion will rely more heavily on declining savings, credit use, or asset income, and the quality of growth may further weaken.Employment resilience limits policy easing space
For the week ending July 25, initial jobless claims totaled 197,000, an increase of 9,000 from the previous week, but still below market expectations of 200,000. Continuing claims fell to 1.782 million, below the expected 1.8 million and a more than one-month low. The employment data does not yet indicate that companies are cutting jobs on a large scale. This data contrasts with the weak GDP figures. Economic growth has slowed, but the labor market remains relatively stable. For the Federal Reserve, this combination reduces the need for immediate easing to support employment, while allowing it to continue observing whether core inflation has truly fallen. Therefore, the core contradiction in market pricing shifts to whether inflation is cooling faster than the economy is slowing. If core prices continue to decline slowly while employment remains stable, interest rates may remain high for longer; only if employment and income weaken simultaneously will the policy focus more clearly shift towards growth risks.The US dollar index fell below its middle band, with short-term pressure stemming from a revaluation of expectations.
The US dollar index is currently trading around 100.70, having broken below the Bollinger Band middle line at 101.0771 and is close to the lower line at 100.5165. On the daily chart, the index previously encountered resistance near 101.6299 and subsequently declined. The MACD indicator's DIFF line has fallen to 0.1471, below the DEA line's 0.2123, and the histogram has dropped to -0.1304, indicating weakening upward momentum. However, the dollar's pullback does not equate to a complete reversal of macroeconomic logic. Declining overall inflation and slower-than-expected economic growth have lowered expectations for rising interest rates, creating short-term pressure; while high core inflation and stable employment data limit the scope for a rapid decline in interest rates. Meanwhile, long-term Treasury yields remain high, with the 30-year yield reaching 5.240% at one point, reflecting market concerns about long-term inflation, fiscal supply, and term premiums. Therefore, the area around 100.50 not only represents the lower Bollinger Band in the technical chart but also corresponds to a rebalancing zone in market expectations regarding Federal Reserve policy. The dominant factors driving future dollar fluctuations will be the relative strength of core service sector inflation, employment growth, income changes, and long-term yields.
- Risk Warning and Disclaimer
- The market involves risk, and trading may not be suitable for all investors. This article is for reference only and does not constitute personal investment advice, nor does it take into account certain users’ specific investment objectives, financial situation, or other needs. Any investment decisions made based on this information are at your own risk.