Gold's descending wedge pattern is nearing its end; what are the true breakout conditions?
2026-08-03 17:44:51
On Monday, August 3, spot gold traded around $4,055 per ounce, up about 0.3% on the day, but still hadn't broken free from the mid-term correction structure that had formed since July. The dollar index fell back to around 99.8, and long-term US Treasury yields eased from their highs, providing support for gold prices. Meanwhile, the Federal Reserve maintained a tight policy stance, and market expectations for a September rate hike remained high, limiting the valuation expansion of non-interest-bearing assets. Energy prices fell significantly due to expectations of dialogue between the US and Iran, and both safe-haven and inflation premiums cooled simultaneously, putting gold in a phase where pricing is jointly influenced by interest rates, the dollar, and employment data. 
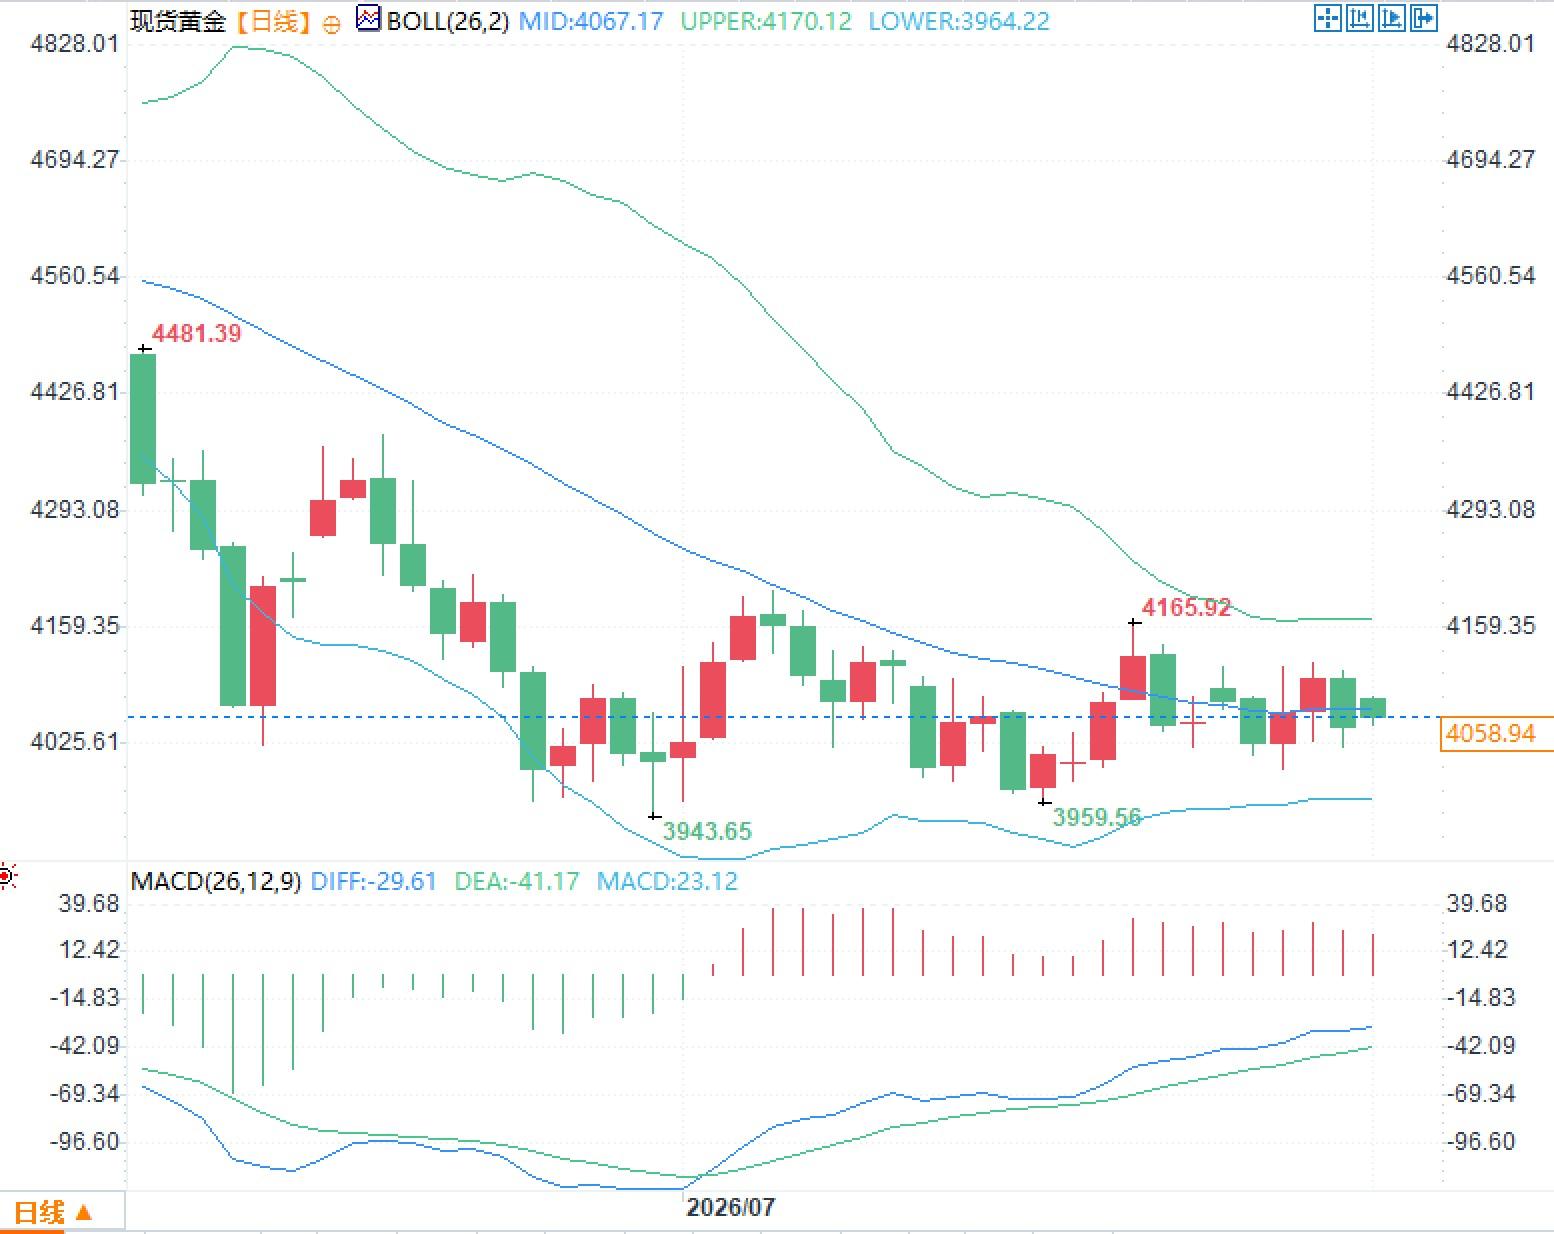 The MACD fast line is at -29.61, the slow line at -41.17, and the histogram has rebounded to 23.12, indicating that the downward momentum continues to weaken. However, both trend lines are still below the zero axis, so the current signal is more like a correction within a downtrend than a complete reversal. The recent lows of $3943.65 and $3959.56 form a dense support zone below, while the recent rebound high of $4165.92 is close to the upper Bollinger Band. If the price continues to hold above $4067, the technical center of gravity may move towards the $4166-$4170 area; if it encounters resistance again near the middle Bollinger Band, the descending wedge pattern remains valid, and the market may continue to seek equilibrium within the $4025-$3960 range.
The core issue in gold trading remains the real interest rate.
This round of gold price rebound is not solely driven by safe-haven demand. Spot gold has recovered from below $4040 to around $4055, mainly due to a weakening dollar and falling US Treasury yields, rather than a resurgence of risk events. Under the dollar-denominated system, a decline in the dollar index reduces the exchange rate costs for non-dollar funds holding gold; falling bond yields reduce the opportunity cost of holding non-interest-bearing gold. However, this support is currently insufficient to drive a trend reversal. The Federal Reserve previously maintained its target range for the federal funds rate at 3.50% to 3.75% and continued to emphasize inflation constraints. The probability of a September rate hike, reflected in interest rate futures, has recently fluctuated around 57%, lower than the pricing of over 60% at times, but still indicating that the market has not shifted to an easing strategy. It is worth noting that gold recorded its first monthly gain in five months in July, indicating that medium- to long-term allocation funds have not fully exited, while short-term funds are still rapidly adjusting their positions around the interest rate path. The current market is closer to a rebalancing of bulls and bears than a confirmed direction.Why didn't the drop in oil prices directly suppress gold prices?
Following the US's postponement of further action against Iran and signaling the start of dialogue, international oil prices fell by more than $4 in a single day, with Brent crude dropping back to around $83 per barrel. Typically, easing conflict risks reduce gold's safe-haven premium. However, this oil price decline also eased concerns about energy-imported inflation, reducing the need for further tightening by the Federal Reserve. Therefore, gold did not fall with the easing of safe-haven demand; instead, it received support from improved interest rate expectations. Currently, rising oil prices imply more inflationary pressure and the risk of interest rate hikes, which could potentially push up real interest rates and suppress gold prices. Conversely, falling oil prices could indirectly benefit gold by lowering inflation expectations and reducing bond yields.Employment data will determine whether the interest rate trade can continue.
The most crucial data this week is the US July non-farm payrolls report, to be released on August 7th. June's non-farm payrolls only increased by 57,000, with an unemployment rate of 4.2%, indicating a cooling labor market. If July's job growth remains weak, the market may lower its probability of a September rate hike, putting pressure on the dollar and US Treasury yields, and providing more stable valuation support for gold. Conversely, if employment, wage growth, and working hours data all strengthen simultaneously, the risk of rising interest rates may again suppress gold prices. Data interpretation should not focus solely on the number of new jobs. Average hourly wages determine the stickiness of inflation, the unemployment rate reflects labor supply and demand, and revisions to the previous two months' data affect the accuracy of employment trends. For gold, the most unfavorable combination is resilient employment, high wage growth, and a rebound in energy prices, as this would simultaneously raise nominal interest rates and inflation expectations.The technical structure is nearing the end of its convergence phase, with $4067 becoming a short-term watershed.
From the daily chart, spot gold is trading within a descending wedge pattern, with the Bollinger Band middle line at $4067.17, the upper line at $4170.12, and the lower line at $3964.22. The latest price is still slightly below the middle line, indicating that the rebound has not yet broken through the medium-term equilibrium zone. The MACD fast line is at -29.61, the slow line at -41.17, and the histogram has rebounded to 23.12, indicating that the downward momentum continues to weaken. However, both trend lines are still below the zero axis, so the current signal is more like a correction within a downtrend than a complete reversal. The recent lows of $3943.65 and $3959.56 form a dense support zone below, while the recent rebound high of $4165.92 is close to the upper Bollinger Band. If the price continues to hold above $4067, the technical center of gravity may move towards the $4166-$4170 area; if it encounters resistance again near the middle Bollinger Band, the descending wedge pattern remains valid, and the market may continue to seek equilibrium within the $4025-$3960 range.
- Risk Warning and Disclaimer
- The market involves risk, and trading may not be suitable for all investors. This article is for reference only and does not constitute personal investment advice, nor does it take into account certain users’ specific investment objectives, financial situation, or other needs. Any investment decisions made based on this information are at your own risk.