Why did gold prices fall during the geopolitical crisis?
2026-08-04 02:24:54
Whenever international tensions rise, the narrative of gold as the "ultimate safe-haven asset" sweeps across major media outlets. However, looking at the spot gold price chart, the glaring bearish candlestick creates a bizarre contrast with the clamor in the news headlines—on January 29, 2026, gold prices reached a record high of approximately $5,595, but against the backdrop of the Strait of Hormuz crisis pushing Brent crude oil prices above $100 and US inflation soaring to 4.2%, gold prices plummeted by about 27% to around $4,080 within a few months, marking the worst quarterly performance in 13 years.  The crisis continues, and gold is falling. This isn't a market "failure," but rather a misinterpretation of the pricing logic of gold. Gold is never a thermometer of fear; it's a non-interest-bearing, dollar-denominated financial asset. Its price is primarily governed by the ironclad laws of interest rates, exchange rates, and liquidity, and only secondarily by the clamor of geopolitics. I. The Nature of Gold: An Overlooked Premise Understanding the starting point of gold's decline requires acknowledging a fundamental fact: gold doesn't generate profits, dividends, or coupon payments. Its entire return comes from price fluctuations. This means that holding gold always carries an "opportunity cost"—you forgo the returns you could have earned with the same amount of money in a risk-free asset. Suppose you hold $100,000 in gold for one year, while the yield on a one-year US Treasury bond is 4.5%. Choosing gold means you're actively forgoing a guaranteed return of $4,500. Gold must rise by 4.5% within a year to barely break even. When the yield rises to 6%, this threshold becomes even higher. For large institutions, when opportunity costs are high, reducing gold holdings isn't an emotional decision, but an arithmetic outcome. This is the first principle behind gold's decline during geopolitical crises: the crisis itself is insufficient to drive up gold prices; only when the crisis alters the "cost-effectiveness of holding gold relative to other assets" will prices respond. II. Five Driving Forces of Decline: From Mechanism to Market In actual trading, the following five forces have dominated the decline in gold prices: 1. Rising Bond Yields: When cash and government bonds begin to pay higher returns, gold's "zero-yield" disadvantage is amplified. Funds flow from gold to interest-bearing assets; this is not prediction, but rebalancing. 2. Stronger Dollar: Gold is priced globally in US dollars. A rising dollar index means buyers in major physical gold-consuming countries like India, China, and Turkey face higher local currency costs, naturally shrinking overseas physical demand. While gold and the dollar may rise together during extreme panic (both are considered the ultimate liquidity), this is an exception, not the norm. 3. Return to Risk Appetite: When stock and credit markets rebound, funds rotate from defensive assets to risk assets, rapidly compressing gold's "safe-haven premium." 4. Profit-Taking: After a long period of gains, long positions become crowded. Any slight disturbance can trigger traders to lock in profits, and once selling pressure exceeds new buying, the trend becomes self-reinforcing. 5. Forced Liquidation This is the most brutal and easily misunderstood mechanism. When leveraged investors suffer losses in other markets, they must quickly raise cash to replenish margin. Due to its extremely high liquidity, gold often becomes the preferred target for "being sold in exchange for liquidity"—they sell not what they want to sell, but what they can sell. From March 9th to 19th, 2020, gold plummeted by about 12% due to a liquidity squeeze, a classic example of this mechanism. By August of the same year, the price of gold had broken records, reaching $2,060. The initial decline was mechanical, while the later rise was a return to fundamentals. III. Deconstructing Three "Counterintuitive" Scenarios Scenario 1: Why is gold falling despite high inflation? This is the most frequently searched question by novice traders. Theoretically, gold is an inflation hedge, but in reality, high inflation often triggers a hawkish shift in central banks. The market begins pricing in interest rate hikes rather than cuts, nominal yields rise faster than inflation expectations, and real interest rates turn positive—a fatal blow to gold. The 2026 correction is a textbook example: the Hormuz crisis drove up oil prices and inflation, but the Fed's rate hike expectations reshaped the real yield curve, and gold continued to decline during the ongoing crisis. Core understanding: Gold hedges against "unexpected inflation" and "monetary credit collapse," not "inflation that central banks are actively combating." Scenario Two: Why does gold fall in tandem with the stock market in the early stages of a market crash? This is not a failure of the safe-haven narrative, but a problem with the underlying market mechanism. On the eve of true panic, margin calls force leveraged investors to sell the most liquid assets at any cost. Gold, precisely because of its liquidity, becomes a "cash withdrawal machine." Scenario Three: Why does gold continue to fall as tensions ease? The market prices expectations, not the events themselves. "Buy the rumor, sell the fact" is an eternal game. Geopolitical risk premiums accumulate during escalation and are released during de-escalation. When diplomatic progress eliminates uncertainty, regardless of whether the conflict continues, previously established speculative long positions will be liquidated, putting downward pressure on gold prices. IV. Demand Side and Historical Lessons: When Structural Support Loosens Physical Demand: The "Price Sensitivity" of China and India About half of global annual gold demand comes from jewelry, with China and India dominating this market. When local gold prices surge, rational consumers will choose to wait and see—wedding season gold purchases will be postponed or reduced in weight, and old gold recycling will increase. Supply floods the market at the weakest point of demand. Of course, demand can also "migrate": In the first quarter of 2026, Indian gold demand increased by 10% year-on-year to 151 tons, but funds shifted from jewelry to gold bars, coins, and digital gold. Institutional Fund Flows: The shift of funds from exchange-traded funds and central bank institutions has a greater impact on prices than retail purchases. Redemptions in gold exchange-traded funds force fund managers to sell physical gold, and falling prices trigger more redemptions, creating a negative feedback loop. The liquidation of speculative futures positions further exacerbates the pressure. Central banks play the opposite role. Global central bank net gold purchases in 2025 are estimated at approximately 863 tons, the fourth highest level in history, forming a structural bottom for the market. However, the real risk is not central bank selling (which is extremely rare now), but rather a slowdown in the pace of gold purchases—when the most stable buying pressure thins, the market becomes more vulnerable to speculative flows. A common thread in the five major historical declines...
 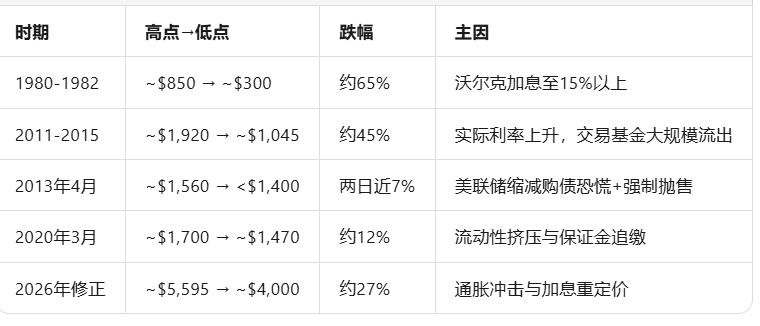 Spanning decades, every deep correction leaves the same fingerprints: rising real interest rates or expected rising rates, crowded long positions from the previous period, leverage amplifying the decline, and bullish narratives still being loudly proclaimed during the fall. After the peak in 1980, gold didn't recover its losses until January 2008—a 28-year wait, enough to make any unplanned investor who bought at the top pay a heavy price. V. Exchange Rate Perspective: Your Gold May Not Be "His Gold" For non-US dollar investors, an often overlooked dimension is the exchange rate. Gold is priced in US dollars, but your actual returns are settled in your local currency. Take the Malaysian Ringgit as an example:
 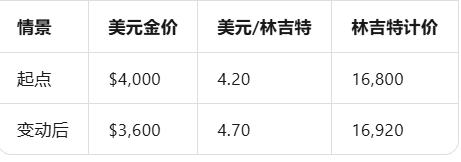 The US dollar gold price fell 10%, but the Malaysian ringgit depreciated by 11.9%, resulting in a slight profit of 0.7% for local investors. This is why international news headlines often contradict your local gold price. Historically, gold has been the best protector of savers in countries with depreciating currencies. Practical tip: Open both the gold/dollar and your local currency exchange rate charts (e.g., USD/MYR) on a major trading platform, and multiply them to get the gold price in your local currency. It is recommended to observe trends on a monthly basis to filter out daily noise. VI. Trading in a Falling Market: From "Prediction" to "Conditional Judgment" Traders often ask: Will gold go up or down next? The honest answer is: nobody knows. Major banks' 12-month gold price targets often diverge by more than 25%. A better approach is conditional thinking—not prediction, but defining "what conditions will be met and what scenarios will dominate": If real interest rates decline and the dollar weakens → Gold's logic strengthens; If inflation is persistent and central banks continue tightening → Headwinds persist; If liquidity events cause an impact → A fall followed by a recovery; If central banks continue to increase their holdings → A floor is reached. Two-way trading and risk control: A falling market is only bad news for those who "can only go long." Gold CFDs allow two-way positions, meaning the downward logic itself is tradable. However, leverage is a double-edged sword. Professional traders' risk control logic is "to deduce position size from risk, rather than amplifying it from belief": Account balance $5,000 → Single trade risk 1% ($50) → Planned stop-loss distance $25 → Risk per standard lot $2,500 → Correct position size: 50/2,500 = 0.02 lots. During a crisis, gold's daily volatility may double, requiring a corresponding increase in stop-loss width, while reducing position size to maintain cash risk. Every position must have a stop-loss order, leverage should be reduced during periods of high volatility, and heavy positions should be avoided before major data releases—and trading logs should be written down to distinguish between "bad luck" and "bad processes." Supplementary tool: The gold/silver ratio can be used as a relative value indicator. When the ratio is at a historical high, some traders consider increasing their silver allocation and reducing their gold allocation, expecting the ratio to revert to the mean. However, it should be noted that silver is more volatile and has stronger industrial attributes, making the strategy risky. Conclusion: From "Contradiction" to "Information" —Gold price declines during geopolitical crises are never a market paradox, but rather a manifestation of pricing mechanisms. Real interest rates, the US dollar, position crowding, and liquidity conditions explain almost every major decline in history—including those that occurred during war and panic. When you understand these driving factors, the red candles on the chart are no longer an irony of the "collapse of the safe-haven myth," but rather interpretable and manageable market information. Gold never prices for fear; it prices for "holding costs" and "alternative options." Remember this, and you will surpass most traders who chase highs and lows based on news headlines.
The crisis continues, and gold is falling. This isn't a market "failure," but rather a misinterpretation of the pricing logic of gold. Gold is never a thermometer of fear; it's a non-interest-bearing, dollar-denominated financial asset. Its price is primarily governed by the ironclad laws of interest rates, exchange rates, and liquidity, and only secondarily by the clamor of geopolitics. I. The Nature of Gold: An Overlooked Premise Understanding the starting point of gold's decline requires acknowledging a fundamental fact: gold doesn't generate profits, dividends, or coupon payments. Its entire return comes from price fluctuations. This means that holding gold always carries an "opportunity cost"—you forgo the returns you could have earned with the same amount of money in a risk-free asset. Suppose you hold $100,000 in gold for one year, while the yield on a one-year US Treasury bond is 4.5%. Choosing gold means you're actively forgoing a guaranteed return of $4,500. Gold must rise by 4.5% within a year to barely break even. When the yield rises to 6%, this threshold becomes even higher. For large institutions, when opportunity costs are high, reducing gold holdings isn't an emotional decision, but an arithmetic outcome. This is the first principle behind gold's decline during geopolitical crises: the crisis itself is insufficient to drive up gold prices; only when the crisis alters the "cost-effectiveness of holding gold relative to other assets" will prices respond. II. Five Driving Forces of Decline: From Mechanism to Market In actual trading, the following five forces have dominated the decline in gold prices: 1. Rising Bond Yields: When cash and government bonds begin to pay higher returns, gold's "zero-yield" disadvantage is amplified. Funds flow from gold to interest-bearing assets; this is not prediction, but rebalancing. 2. Stronger Dollar: Gold is priced globally in US dollars. A rising dollar index means buyers in major physical gold-consuming countries like India, China, and Turkey face higher local currency costs, naturally shrinking overseas physical demand. While gold and the dollar may rise together during extreme panic (both are considered the ultimate liquidity), this is an exception, not the norm. 3. Return to Risk Appetite: When stock and credit markets rebound, funds rotate from defensive assets to risk assets, rapidly compressing gold's "safe-haven premium." 4. Profit-Taking: After a long period of gains, long positions become crowded. Any slight disturbance can trigger traders to lock in profits, and once selling pressure exceeds new buying, the trend becomes self-reinforcing. 5. Forced Liquidation This is the most brutal and easily misunderstood mechanism. When leveraged investors suffer losses in other markets, they must quickly raise cash to replenish margin. Due to its extremely high liquidity, gold often becomes the preferred target for "being sold in exchange for liquidity"—they sell not what they want to sell, but what they can sell. From March 9th to 19th, 2020, gold plummeted by about 12% due to a liquidity squeeze, a classic example of this mechanism. By August of the same year, the price of gold had broken records, reaching $2,060. The initial decline was mechanical, while the later rise was a return to fundamentals. III. Deconstructing Three "Counterintuitive" Scenarios Scenario 1: Why is gold falling despite high inflation? This is the most frequently searched question by novice traders. Theoretically, gold is an inflation hedge, but in reality, high inflation often triggers a hawkish shift in central banks. The market begins pricing in interest rate hikes rather than cuts, nominal yields rise faster than inflation expectations, and real interest rates turn positive—a fatal blow to gold. The 2026 correction is a textbook example: the Hormuz crisis drove up oil prices and inflation, but the Fed's rate hike expectations reshaped the real yield curve, and gold continued to decline during the ongoing crisis. Core understanding: Gold hedges against "unexpected inflation" and "monetary credit collapse," not "inflation that central banks are actively combating." Scenario Two: Why does gold fall in tandem with the stock market in the early stages of a market crash? This is not a failure of the safe-haven narrative, but a problem with the underlying market mechanism. On the eve of true panic, margin calls force leveraged investors to sell the most liquid assets at any cost. Gold, precisely because of its liquidity, becomes a "cash withdrawal machine." Scenario Three: Why does gold continue to fall as tensions ease? The market prices expectations, not the events themselves. "Buy the rumor, sell the fact" is an eternal game. Geopolitical risk premiums accumulate during escalation and are released during de-escalation. When diplomatic progress eliminates uncertainty, regardless of whether the conflict continues, previously established speculative long positions will be liquidated, putting downward pressure on gold prices. IV. Demand Side and Historical Lessons: When Structural Support Loosens Physical Demand: The "Price Sensitivity" of China and India About half of global annual gold demand comes from jewelry, with China and India dominating this market. When local gold prices surge, rational consumers will choose to wait and see—wedding season gold purchases will be postponed or reduced in weight, and old gold recycling will increase. Supply floods the market at the weakest point of demand. Of course, demand can also "migrate": In the first quarter of 2026, Indian gold demand increased by 10% year-on-year to 151 tons, but funds shifted from jewelry to gold bars, coins, and digital gold. Institutional Fund Flows: The shift of funds from exchange-traded funds and central bank institutions has a greater impact on prices than retail purchases. Redemptions in gold exchange-traded funds force fund managers to sell physical gold, and falling prices trigger more redemptions, creating a negative feedback loop. The liquidation of speculative futures positions further exacerbates the pressure. Central banks play the opposite role. Global central bank net gold purchases in 2025 are estimated at approximately 863 tons, the fourth highest level in history, forming a structural bottom for the market. However, the real risk is not central bank selling (which is extremely rare now), but rather a slowdown in the pace of gold purchases—when the most stable buying pressure thins, the market becomes more vulnerable to speculative flows. A common thread in the five major historical declines... Spanning decades, every deep correction leaves the same fingerprints: rising real interest rates or expected rising rates, crowded long positions from the previous period, leverage amplifying the decline, and bullish narratives still being loudly proclaimed during the fall. After the peak in 1980, gold didn't recover its losses until January 2008—a 28-year wait, enough to make any unplanned investor who bought at the top pay a heavy price. V. Exchange Rate Perspective: Your Gold May Not Be "His Gold" For non-US dollar investors, an often overlooked dimension is the exchange rate. Gold is priced in US dollars, but your actual returns are settled in your local currency. Take the Malaysian Ringgit as an example: The US dollar gold price fell 10%, but the Malaysian ringgit depreciated by 11.9%, resulting in a slight profit of 0.7% for local investors. This is why international news headlines often contradict your local gold price. Historically, gold has been the best protector of savers in countries with depreciating currencies. Practical tip: Open both the gold/dollar and your local currency exchange rate charts (e.g., USD/MYR) on a major trading platform, and multiply them to get the gold price in your local currency. It is recommended to observe trends on a monthly basis to filter out daily noise. VI. Trading in a Falling Market: From "Prediction" to "Conditional Judgment" Traders often ask: Will gold go up or down next? The honest answer is: nobody knows. Major banks' 12-month gold price targets often diverge by more than 25%. A better approach is conditional thinking—not prediction, but defining "what conditions will be met and what scenarios will dominate": If real interest rates decline and the dollar weakens → Gold's logic strengthens; If inflation is persistent and central banks continue tightening → Headwinds persist; If liquidity events cause an impact → A fall followed by a recovery; If central banks continue to increase their holdings → A floor is reached. Two-way trading and risk control: A falling market is only bad news for those who "can only go long." Gold CFDs allow two-way positions, meaning the downward logic itself is tradable. However, leverage is a double-edged sword. Professional traders' risk control logic is "to deduce position size from risk, rather than amplifying it from belief": Account balance $5,000 → Single trade risk 1% ($50) → Planned stop-loss distance $25 → Risk per standard lot $2,500 → Correct position size: 50/2,500 = 0.02 lots. During a crisis, gold's daily volatility may double, requiring a corresponding increase in stop-loss width, while reducing position size to maintain cash risk. Every position must have a stop-loss order, leverage should be reduced during periods of high volatility, and heavy positions should be avoided before major data releases—and trading logs should be written down to distinguish between "bad luck" and "bad processes." Supplementary tool: The gold/silver ratio can be used as a relative value indicator. When the ratio is at a historical high, some traders consider increasing their silver allocation and reducing their gold allocation, expecting the ratio to revert to the mean. However, it should be noted that silver is more volatile and has stronger industrial attributes, making the strategy risky. Conclusion: From "Contradiction" to "Information" —Gold price declines during geopolitical crises are never a market paradox, but rather a manifestation of pricing mechanisms. Real interest rates, the US dollar, position crowding, and liquidity conditions explain almost every major decline in history—including those that occurred during war and panic. When you understand these driving factors, the red candles on the chart are no longer an irony of the "collapse of the safe-haven myth," but rather interpretable and manageable market information. Gold never prices for fear; it prices for "holding costs" and "alternative options." Remember this, and you will surpass most traders who chase highs and lows based on news headlines.- Risk Warning and Disclaimer
- The market involves risk, and trading may not be suitable for all investors. This article is for reference only and does not constitute personal investment advice, nor does it take into account certain users’ specific investment objectives, financial situation, or other needs. Any investment decisions made based on this information are at your own risk.