Credit Market Watch: Funds Continue to Increase Holdings of US Assets
2026-08-04 01:28:51
There is almost no evidence of a wave of "selling off US assets." More than a year has passed since "Liberation Day" in 2025, and the market is concerned that overseas funds may structurally withdraw from US assets due to US fiscal, political, or dollar-related concerns, but relevant signals remain scarce.  The US corporate bond market is experiencing a large influx of funds, leading to a more divergent landscape. Net purchases of US corporate bonds by overseas funds are expected to reach a record high this year; while net overseas purchases of US Treasuries remain positive, they have fallen to their lowest level since 2021. Changes in relative returns are reshaping the allocation choices of Japanese investors. After currency hedging, the yield on 10-year Japanese government bonds is more attractive than that of US Treasuries, prompting Japanese investors to become net sellers of long-term US Treasuries. When market risk sentiment weakens, US assets still possess hedging value. Compared to other G10 bond markets, US Treasuries offer a yield advantage, supported by the dollar's performance, leading many investors to continue viewing US assets as a hedge against global risks. The "Liberation Day" event in April 2025 triggered market panic, with investors widely fearing a widespread "sell-off of US assets." To this day, we still struggle to find strong evidence to support this assessment. In the US corporate bond market, overseas investors' enthusiasm for allocation remains high. According to the U.S. Treasury Department's Cross-Border Capital Flows (TIC) data, as of the end of May, net purchases of U.S. corporate bonds by overseas funds reached $216 billion. This figure is 32% higher than the May figures for the same period in previous years since the financial crisis, meaning that the total inflow for 2026 is expected to surpass the already strong annual net inflow levels of the past three years. Regardless of any concerns overseas investors may have about U.S. fiscal policy, domestic politics, or the dollar, these concerns have not translated into a withdrawal from U.S. corporate bonds; on the contrary, overseas demand for this asset class has increased. Figure 1: Net purchases of U.S. corporate bonds by overseas funds continue to climb rapidly.
 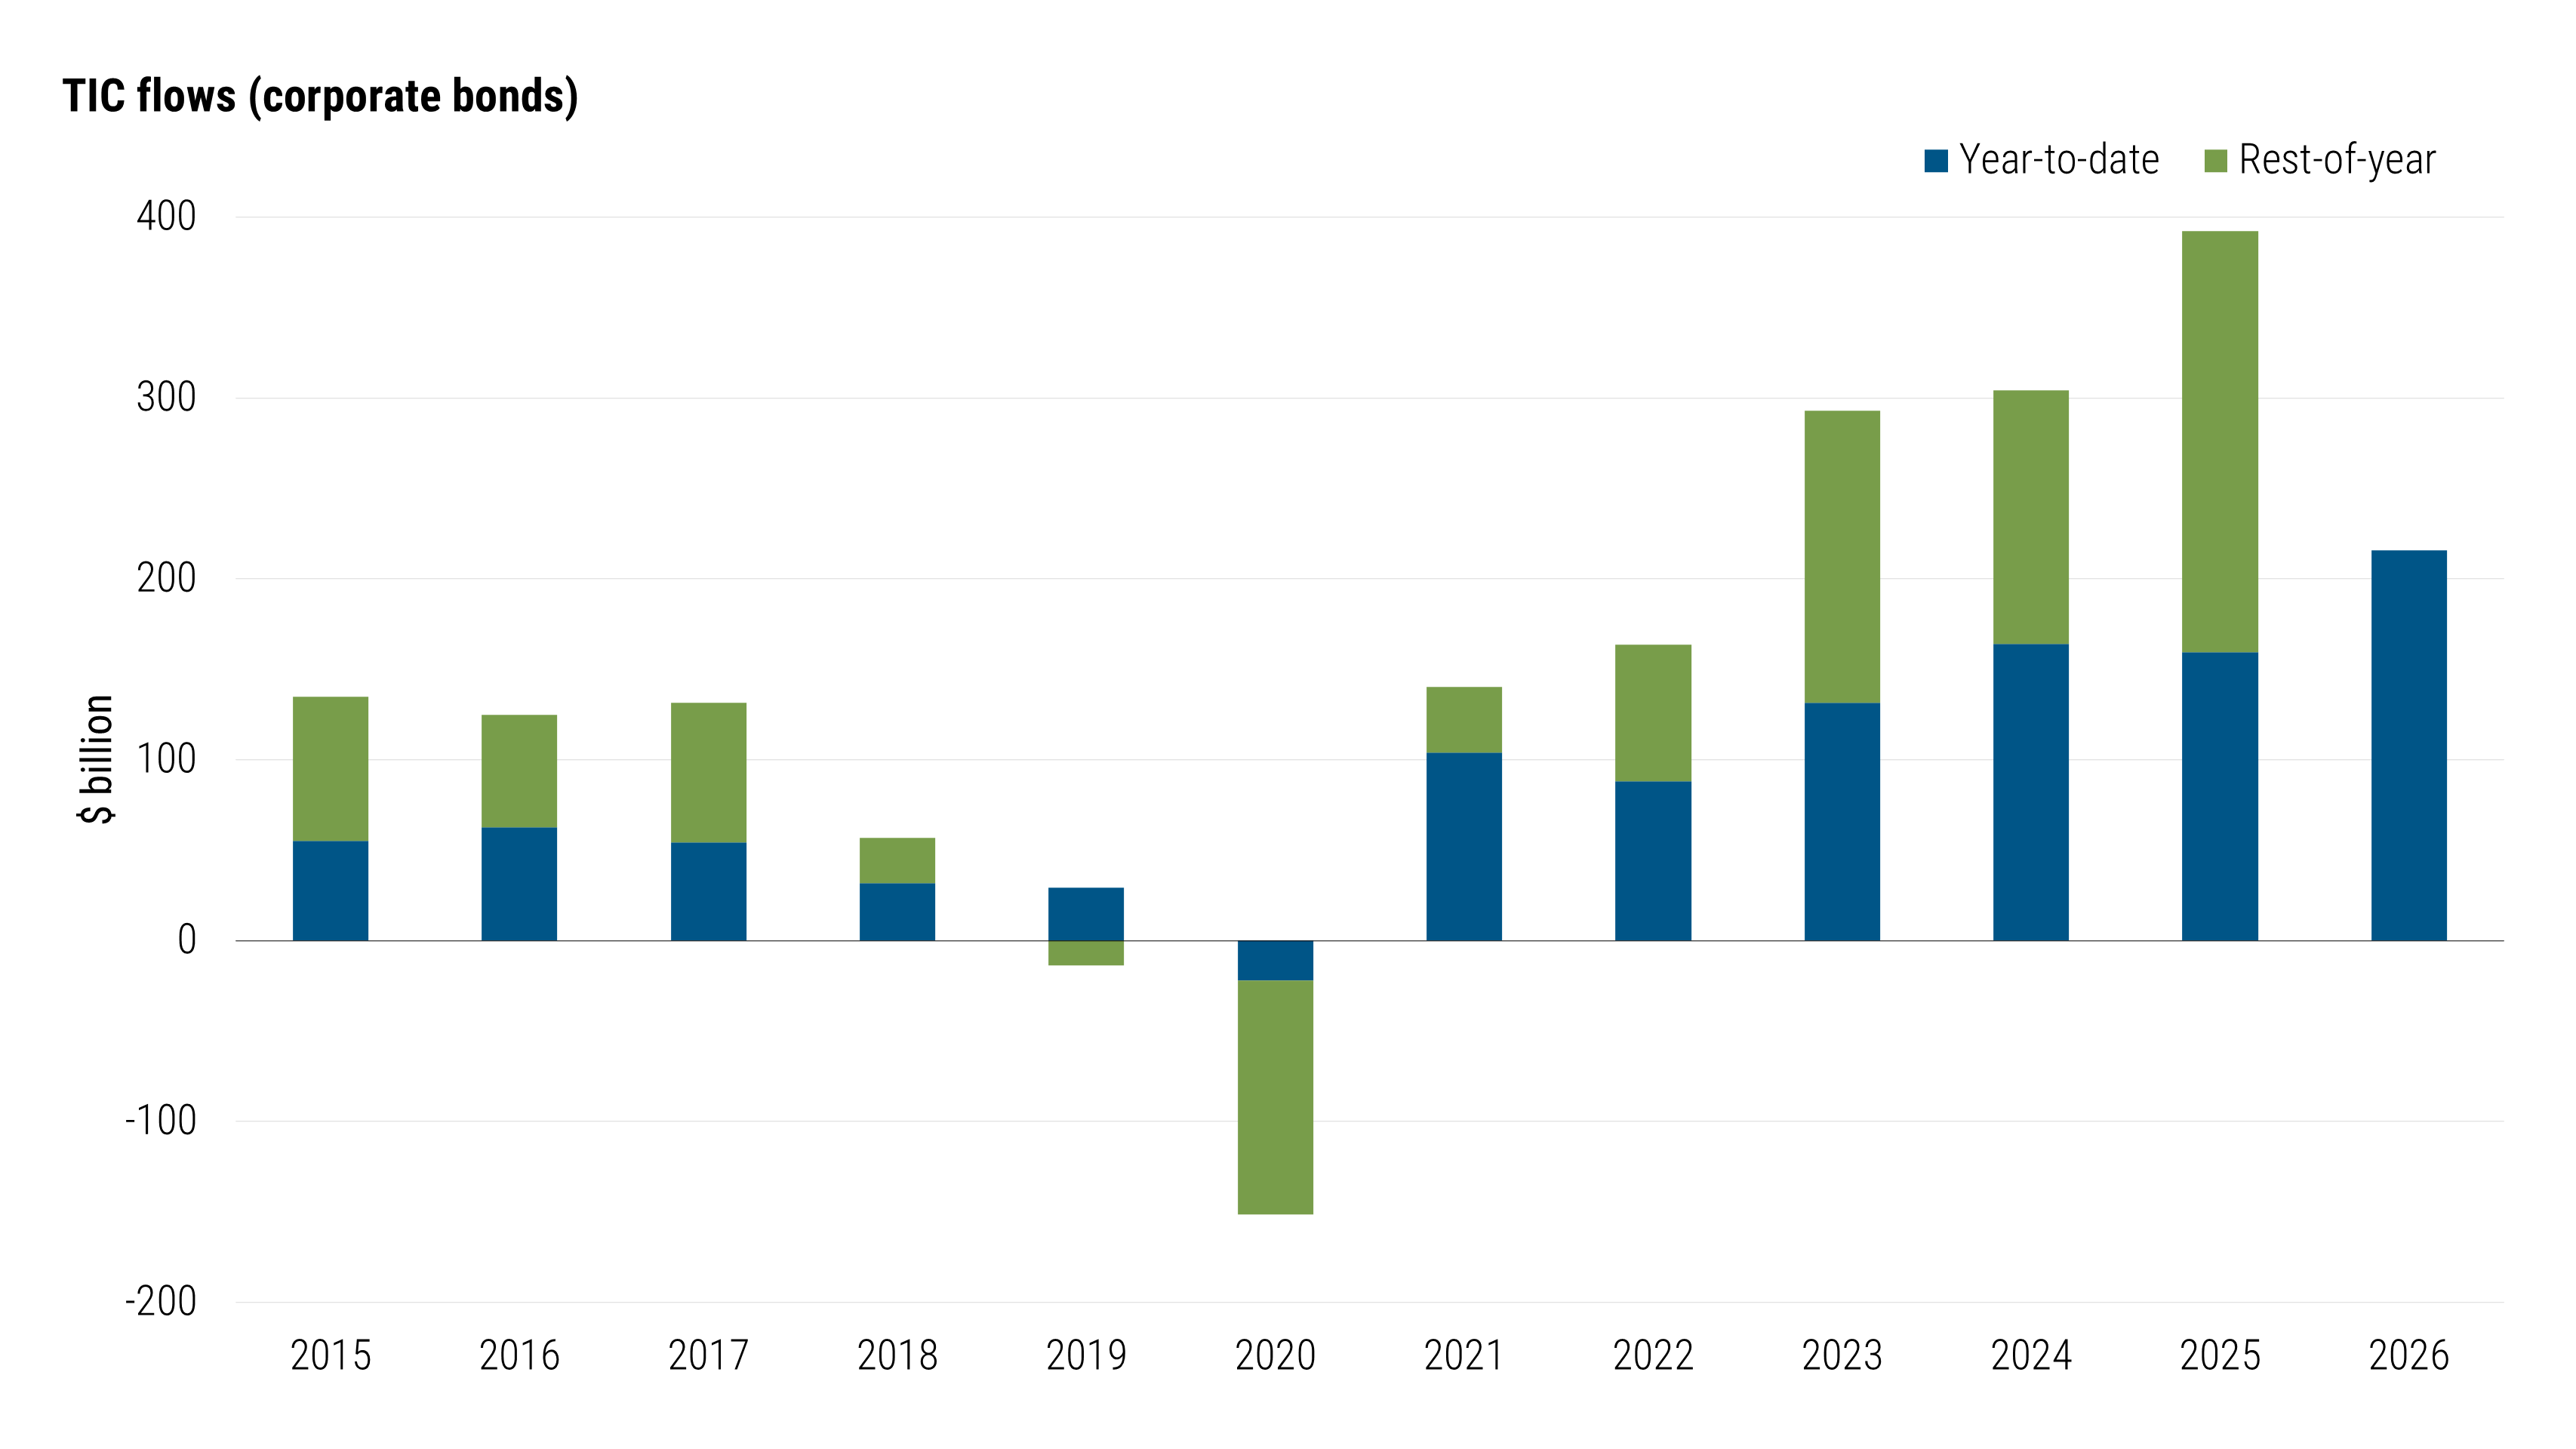 Chart Explanation: This is a bar chart showing the year-to-date and remaining period flow of net overseas purchases of US corporate bonds from 2015 to 2026. Net purchases were negative in 2020, but rebounded significantly thereafter; the year-to-date purchase volume in 2026 is the highest in history for the same period. Data source: US Treasury Department, Harvard Analysis, statistics as of May 31, 2026. The landscape of the sovereign bond market (US Treasuries) is even more divergent. As shown in Figure 2, net overseas purchases of US Treasuries have fallen to a low point since 2021, but the year-to-date purchase volume remains positive. Figure 2: Overseas demand for US Treasuries has cooled slightly.
 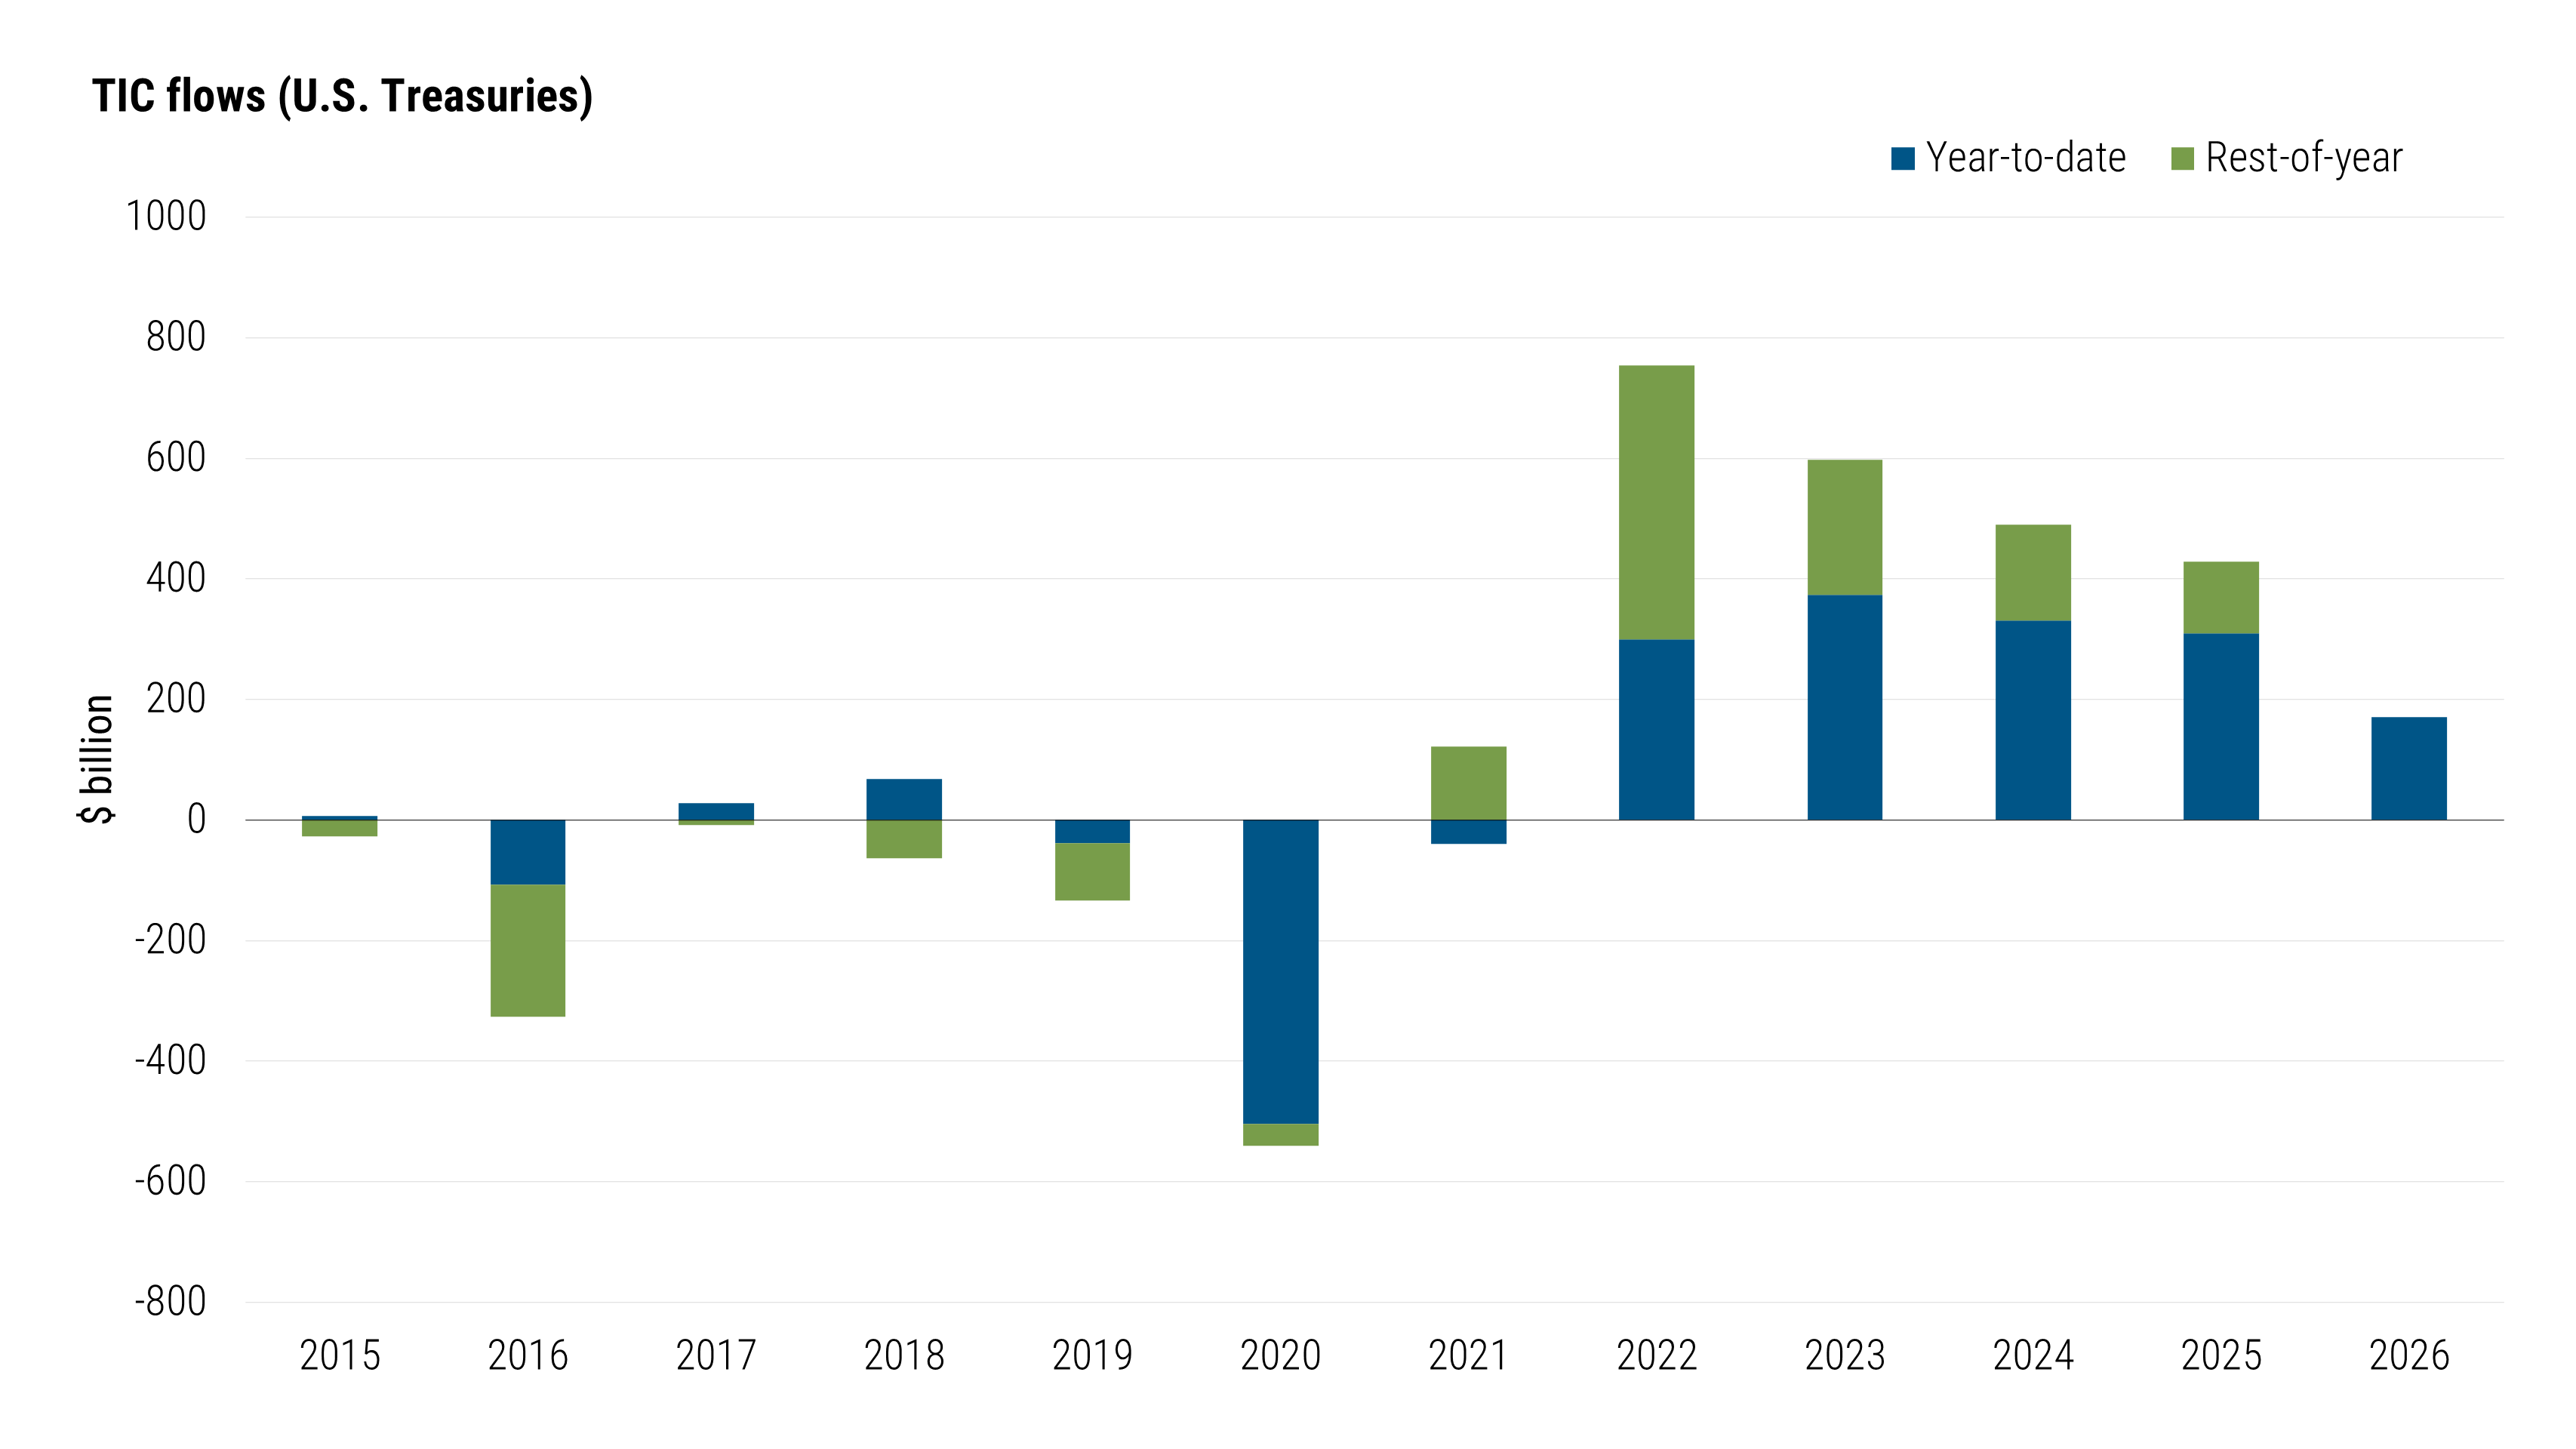 Chart Explanation: A bar chart showing the year-to-date flow and remaining flow of net overseas purchases of US Treasuries from 2015 to 2026. Significant fluctuations in funds were observed, with a marked decline in 2020 and a peak in 2022. While net purchases are still positive year-to-date in 2026, they are lower than recent levels. Data Source: US Treasury Department, Harvard Analysis, statistics as of May 31, 2026. We note that the recent decline in net purchases of US Treasuries is mainly due to a significant contraction in purchases by official institutions, which typically include central banks, foreign exchange reserve management departments, and sovereign wealth funds. As of May, official institutions had accumulated only $6 billion in net purchases since the beginning of the year; in contrast, net purchases by the overseas private sector reached $165 billion (see Figure 3), although both sectors are experiencing a downward trend in their purchases. The driving factors behind this capital outflow are still uncertain, but the most reasonable explanation is that rising sovereign bond yields in other global economies allow for a more effective diversion of domestic funds. Figure 3: Net purchases of US Treasuries by both official and private sectors have declined.
 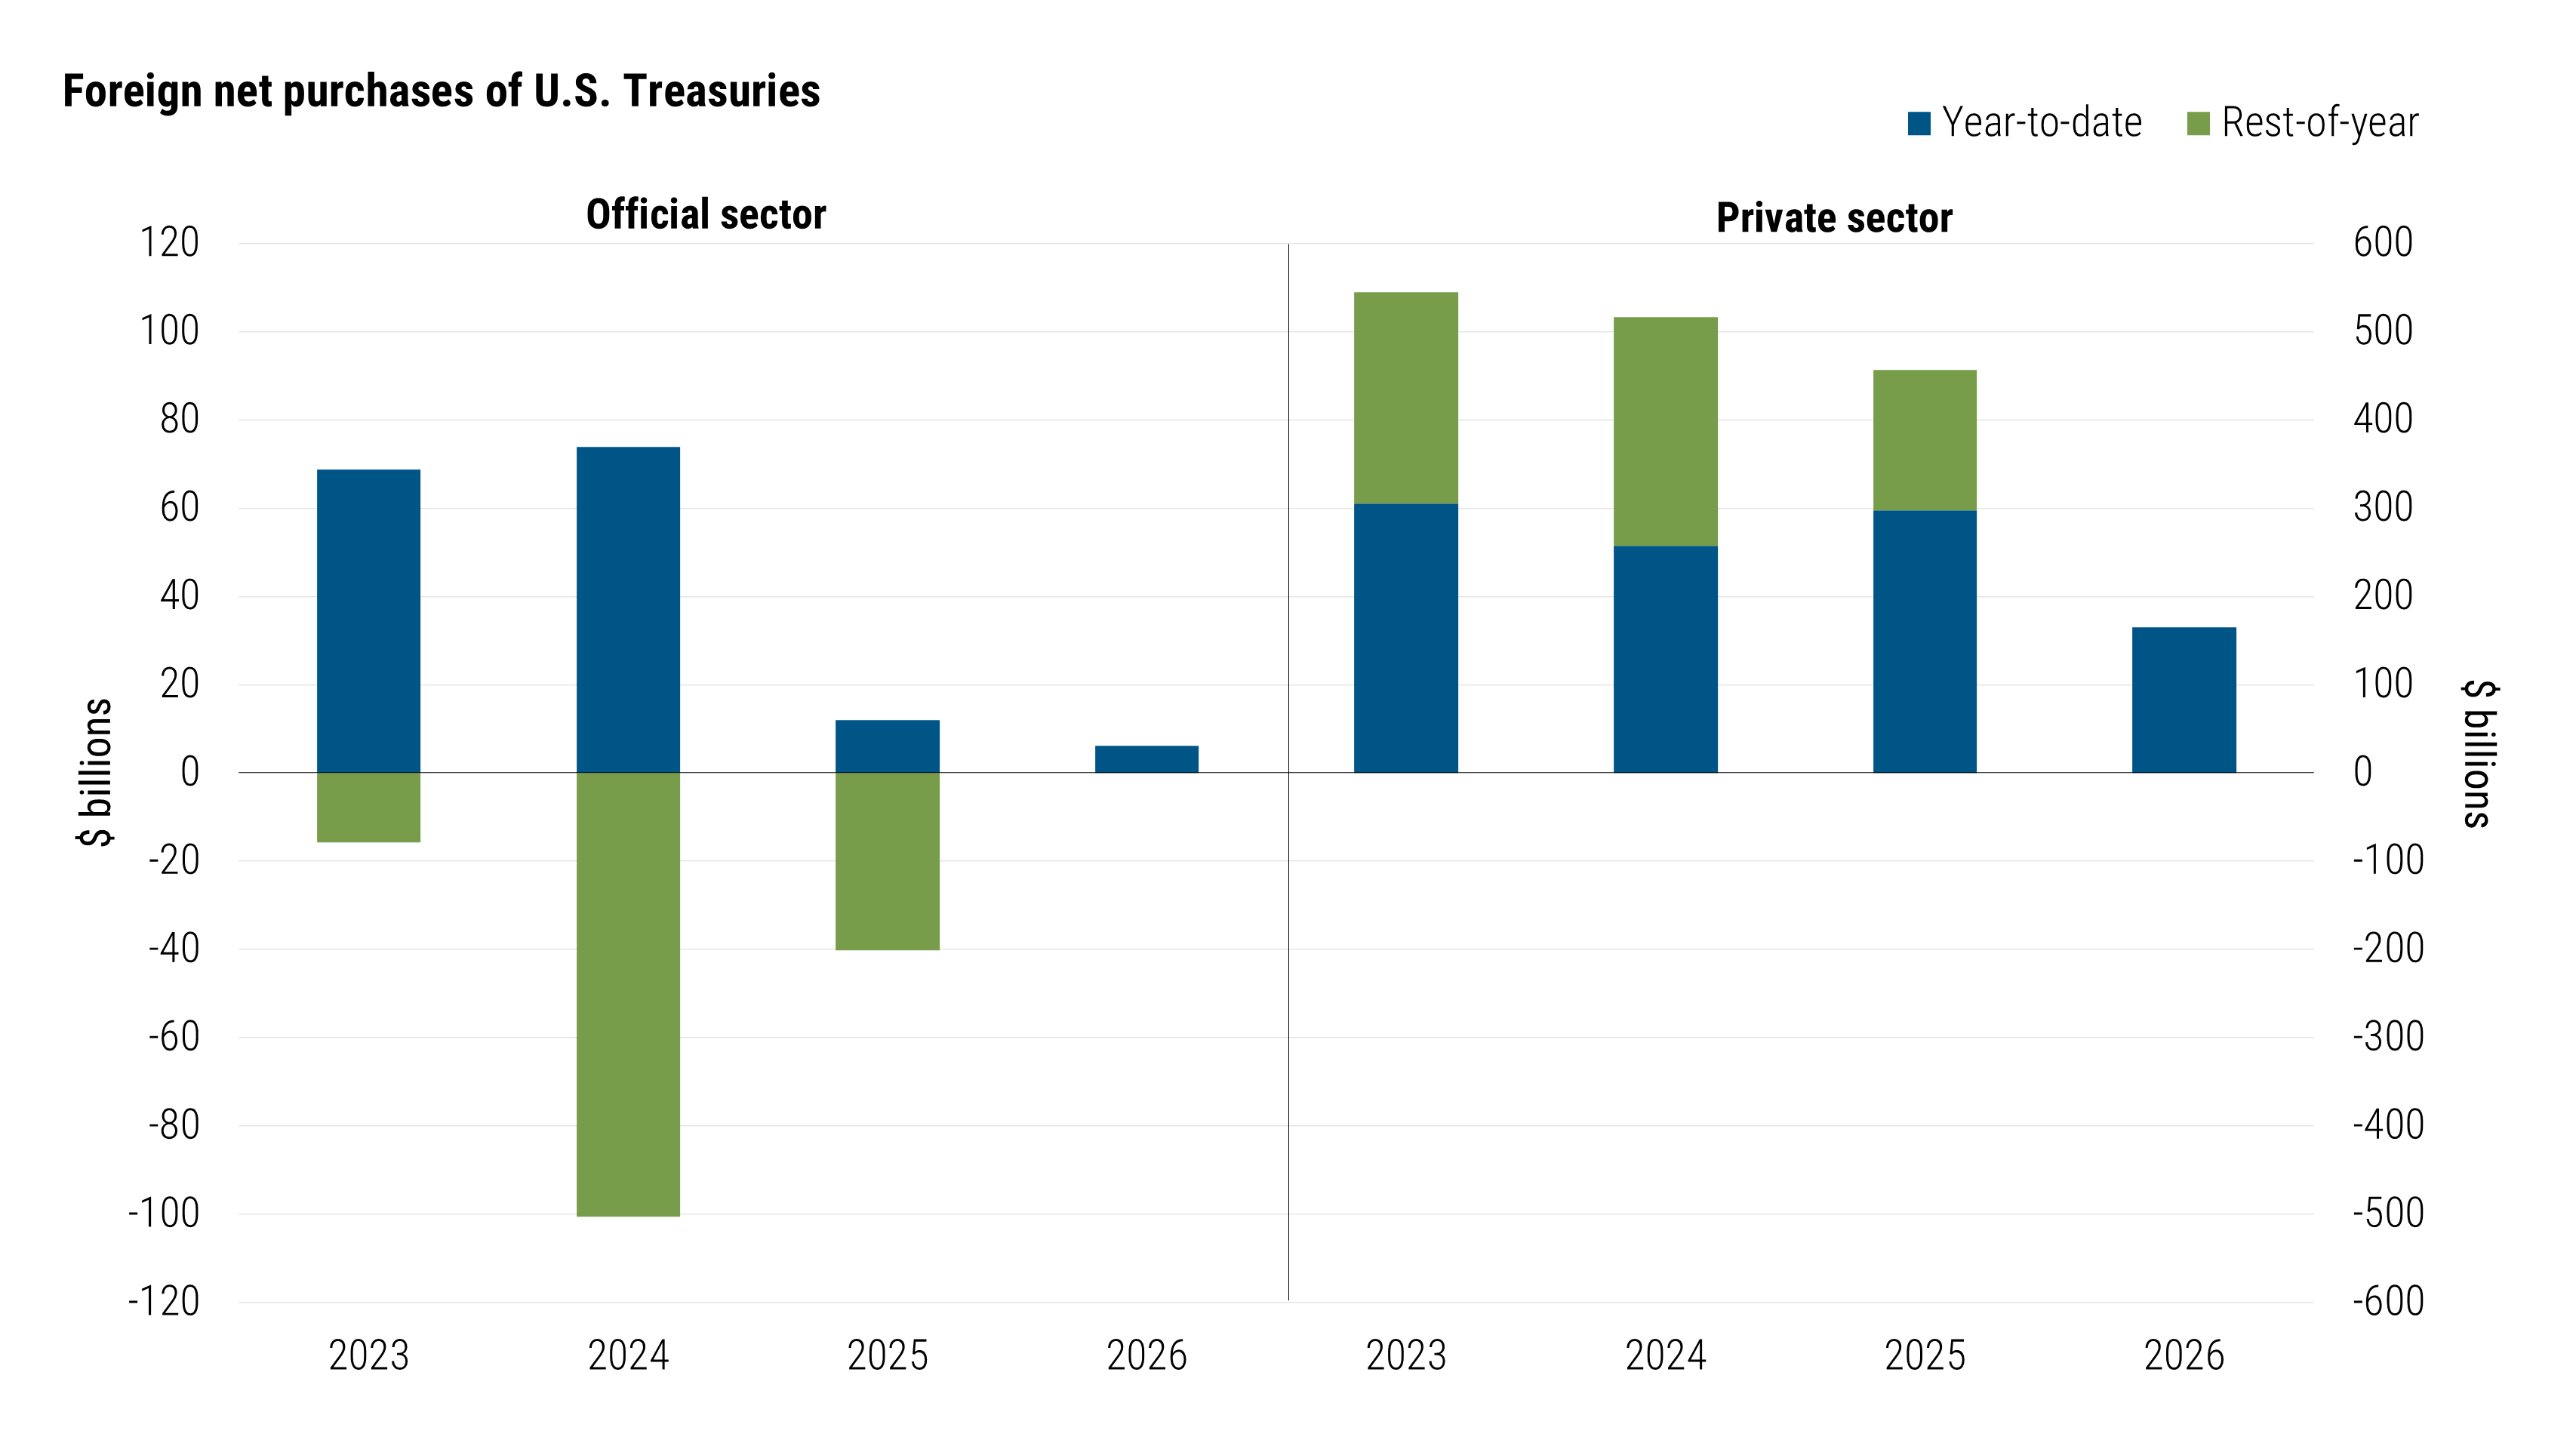 Chart Description: This is a stacked bar chart with two columns, showing net purchases of US Treasuries by overseas official and private investors from 2023 to 2026. Official sector purchases declined sharply after 2024, reaching extremely low levels in 2026; private sector purchases remained positive in 2026, but were lower than the levels seen from 2023 to 2025. Data Source: US Treasury Department, Harvard Analysis, statistics as of May 31, 2026. The most typical observable case of investors shifting from US Treasuries to other competitive sovereign bonds is most likely occurring in Japan. The yield on 10-year Japanese government bonds has climbed to a multi-decade high; after accounting for exchange rate hedging costs, this yield has consistently been higher than that of US Treasuries of the same maturity (see Figure 4). Figure 4: After exchange rate hedging adjustments, the yield on 10-year Japanese government bonds is higher than that of US Treasuries of the same maturity.
 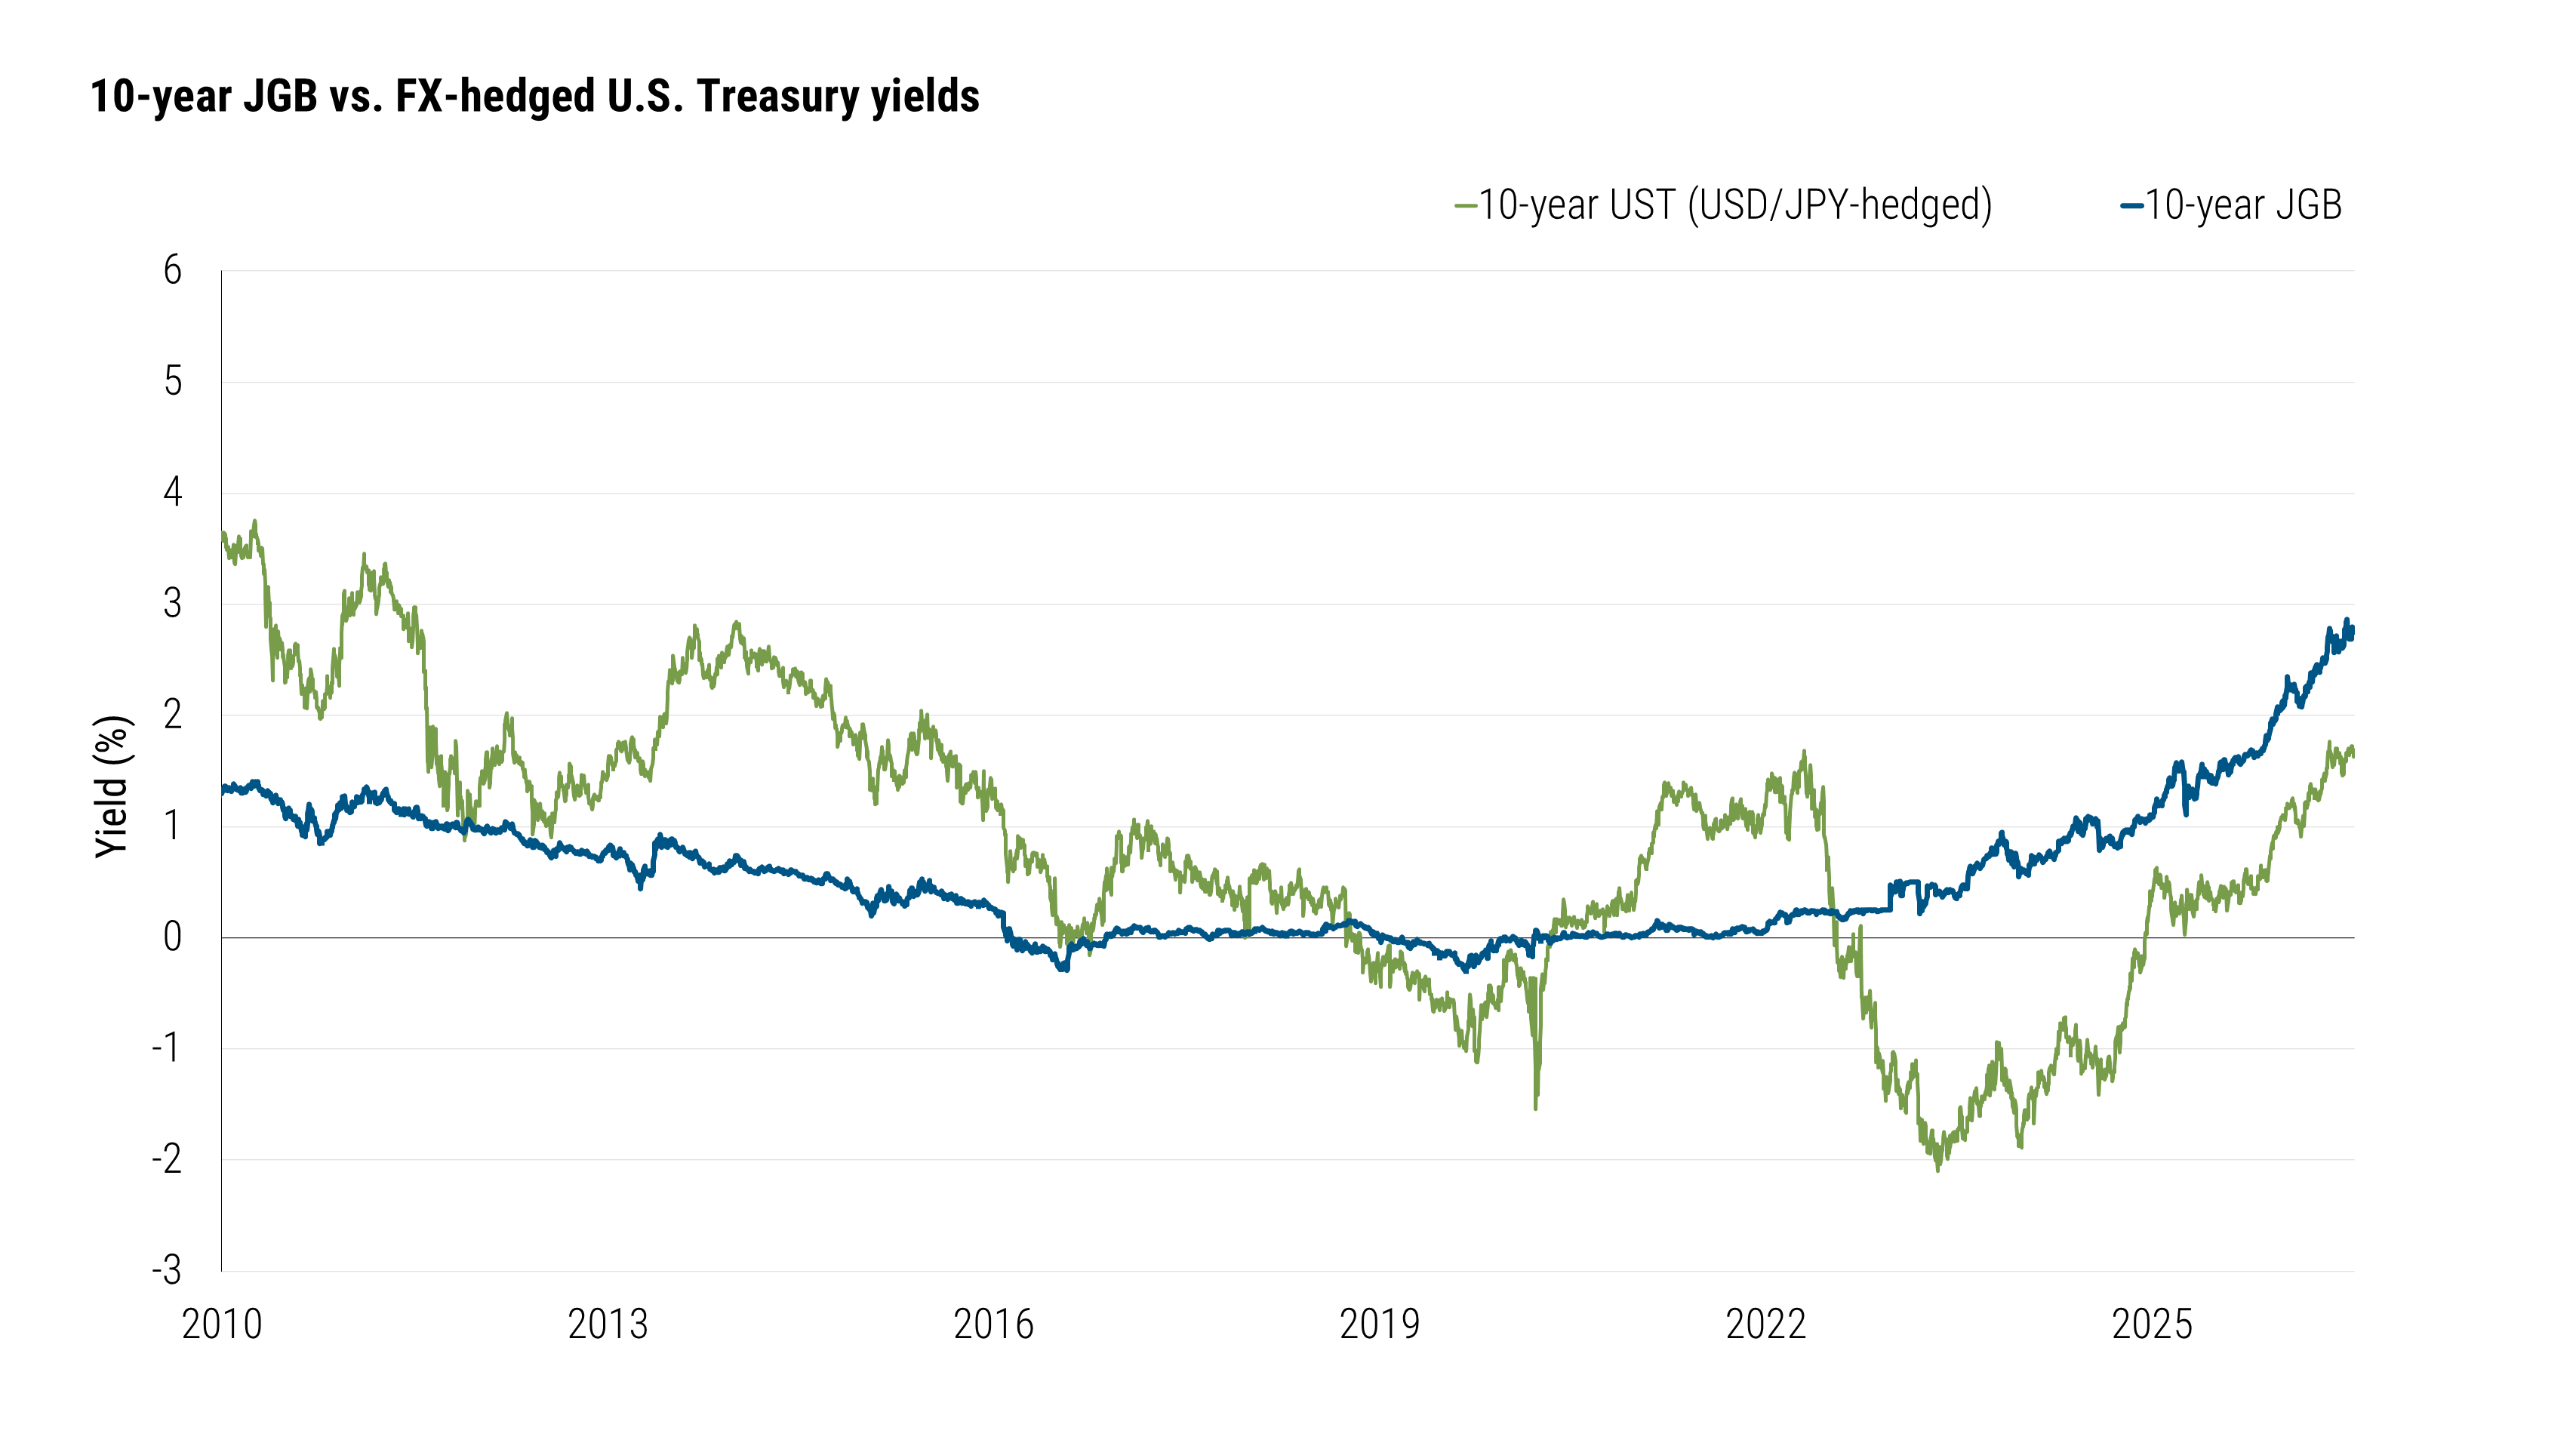 Chart Explanation: A line comparison of the 10-year Japanese government bond yield and the 10-year US Treasury yield after currency hedging, from 2010 to 2026. Japanese bond yields declined steadily in the late 2010s, then rose significantly after 2022; by 2026, Japanese bond yields had exceeded the positive return of US Treasuries after hedging costs. Data Source: Bloomberg, statistics as of July 29, 2026; hedging costs are based on a 3-month rolling calculation combined with Bank of Japan data (Figure 5). From the beginning of 2026 to May, Japanese investors became net sellers of long-term US debt. The Bank of Japan did not separate corporate bond and sovereign bond trading data, but based on US TIC cross-border capital flows data, it is reasonable to infer that net selling was mainly concentrated on US Treasuries. Figure 5: Since 2026, Japanese investors have become net sellers of long-term US bonds.
 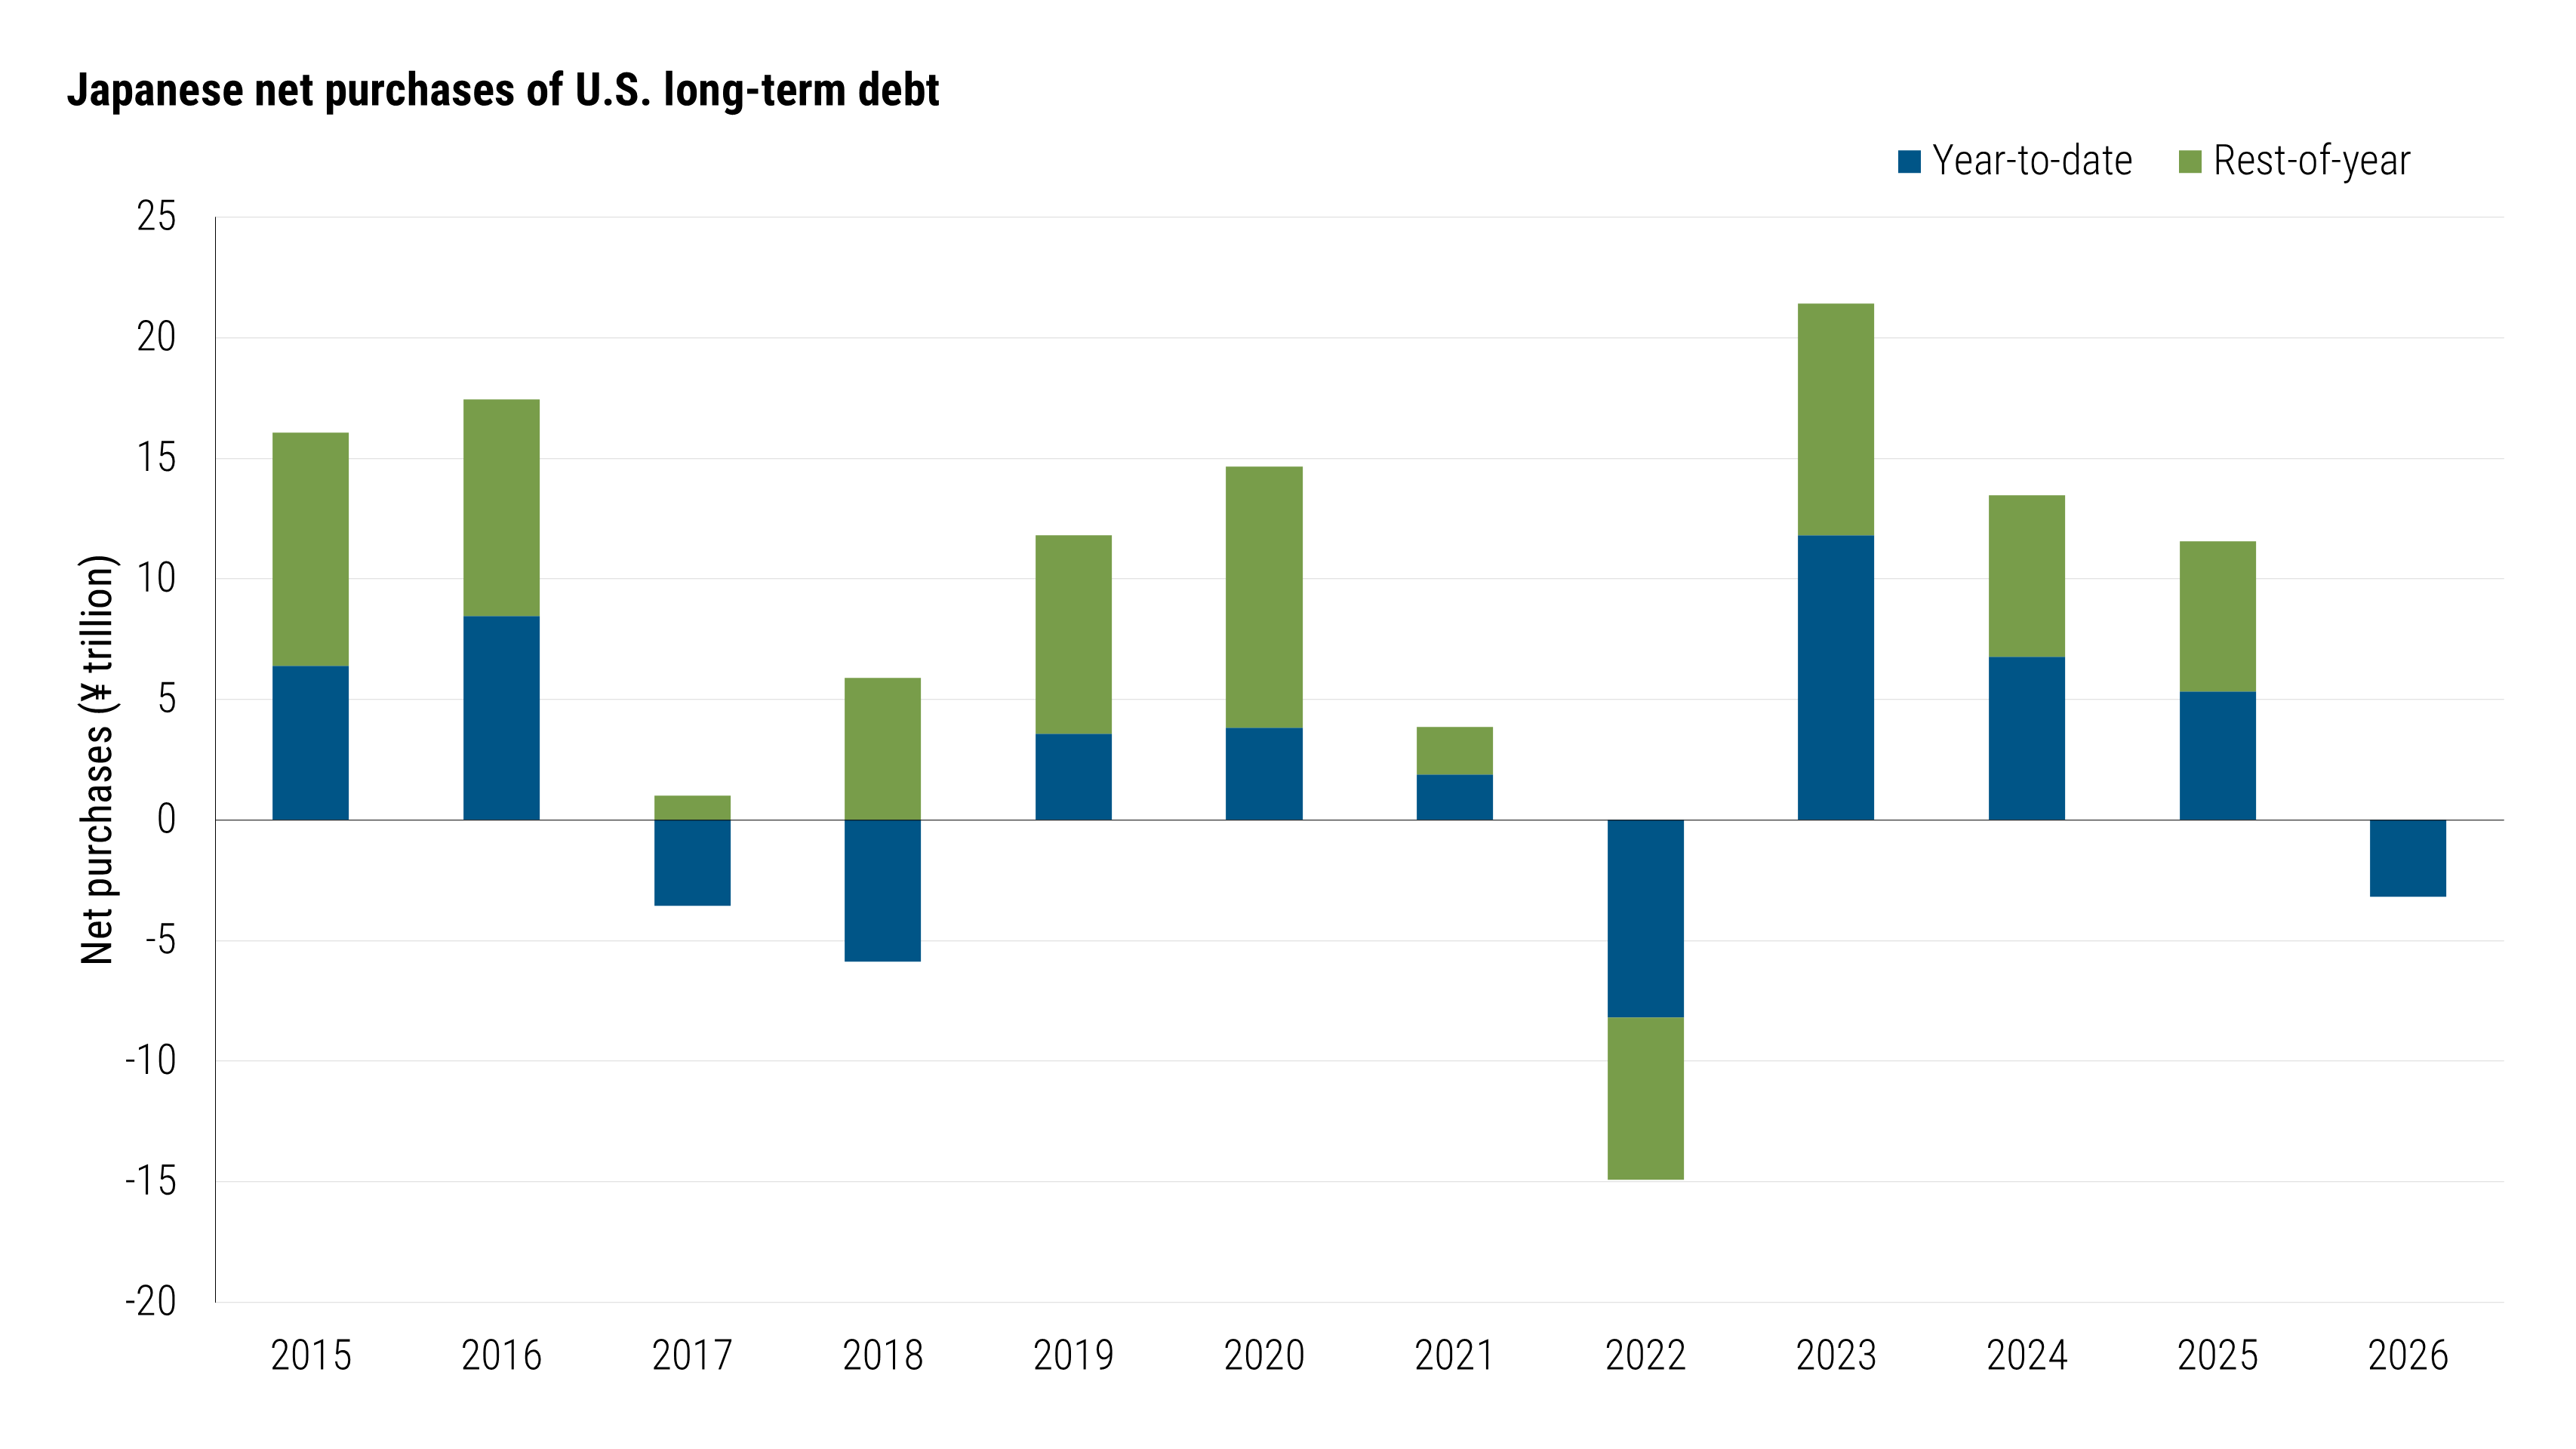 Chart Explanation: Bar chart showing net buying and selling of US long-term bonds by Japanese investors from 2015 to 2026. Funds alternate between net buying and net selling, with the largest net selling in 2022 and the highest net buying in 2023; since the beginning of 2026 , the market has been in a net selling state. Data source: Bank of Japan, Harvard Analysis, statistics as of May 31, 2026. Despite the aforementioned changes in fund flows in the Japanese market, global demand for US assets remains generally stable. Further evidence is the absence of large-scale synchronized selling. So far in 2026, only about 2% of trading days within a 5-day rolling range have seen simultaneous declines in three major asset classes—10-year US Treasury bonds, US investment-grade corporate bond spreads (represented by the Bloomberg US Corporate Bond Total Return Index), and the US dollar index. If the market truly loses confidence in the "unique advantages of US assets," such synchronized selling should become more frequent. Looking back at April 2025, in the short term following the release of news related to "Liberation Day," US Treasuries, credit spreads, and the US dollar did indeed experience a synchronized unfavorable market trend. However, afterward, the traditional correlation between various assets largely returned to normal. This means that the market shock brought about by "Liberation Day" was merely a short-term liquidity misalignment, not a fundamental shift in the long-term market structure. Equally crucial is that when geopolitical conflicts or other risks trigger widespread market turmoil, the US dollar and US Treasuries continue to exhibit their safe-haven asset characteristics. Once risk assets come under pressure, US Treasury yields typically decline, or the US dollar receives financial support. Of course, US Treasuries do not always fulfill their hedging role as intended. For example, when market shocks cause sharp fluctuations in inflation expectations, their safe-haven effect is diminished. Even so, in such environments, US Treasuries often outperform other G10 sovereign bonds. Furthermore, even during periods when long-term US Treasury yields rise and investment-grade credit spreads widen (such as in the early stages of the Iranian conflict this March), the US dollar mostly strengthens. This indicates that investors remain willing to allocate to US assets in the face of global tensions and uncertainties. Overall, global demand for US assets may have declined somewhat compared to previous years, but the absolute scale remains considerable. The aforementioned trends highlight the value of in-depth analysis: fundamentals, capital flows, and relative returns are all indispensable. Our research shows that US assets continue to attract global capital, while also supporting a globalized allocation strategy in the bond market—attractive yield opportunities exist in multiple regions globally. With continued divergence in economic growth, inflation, and monetary policies across countries, diversification in the global fixed-income market is expected to enhance portfolio resilience.
The US corporate bond market is experiencing a large influx of funds, leading to a more divergent landscape. Net purchases of US corporate bonds by overseas funds are expected to reach a record high this year; while net overseas purchases of US Treasuries remain positive, they have fallen to their lowest level since 2021. Changes in relative returns are reshaping the allocation choices of Japanese investors. After currency hedging, the yield on 10-year Japanese government bonds is more attractive than that of US Treasuries, prompting Japanese investors to become net sellers of long-term US Treasuries. When market risk sentiment weakens, US assets still possess hedging value. Compared to other G10 bond markets, US Treasuries offer a yield advantage, supported by the dollar's performance, leading many investors to continue viewing US assets as a hedge against global risks. The "Liberation Day" event in April 2025 triggered market panic, with investors widely fearing a widespread "sell-off of US assets." To this day, we still struggle to find strong evidence to support this assessment. In the US corporate bond market, overseas investors' enthusiasm for allocation remains high. According to the U.S. Treasury Department's Cross-Border Capital Flows (TIC) data, as of the end of May, net purchases of U.S. corporate bonds by overseas funds reached $216 billion. This figure is 32% higher than the May figures for the same period in previous years since the financial crisis, meaning that the total inflow for 2026 is expected to surpass the already strong annual net inflow levels of the past three years. Regardless of any concerns overseas investors may have about U.S. fiscal policy, domestic politics, or the dollar, these concerns have not translated into a withdrawal from U.S. corporate bonds; on the contrary, overseas demand for this asset class has increased. Figure 1: Net purchases of U.S. corporate bonds by overseas funds continue to climb rapidly. Chart Explanation: This is a bar chart showing the year-to-date and remaining period flow of net overseas purchases of US corporate bonds from 2015 to 2026. Net purchases were negative in 2020, but rebounded significantly thereafter; the year-to-date purchase volume in 2026 is the highest in history for the same period. Data source: US Treasury Department, Harvard Analysis, statistics as of May 31, 2026. The landscape of the sovereign bond market (US Treasuries) is even more divergent. As shown in Figure 2, net overseas purchases of US Treasuries have fallen to a low point since 2021, but the year-to-date purchase volume remains positive. Figure 2: Overseas demand for US Treasuries has cooled slightly. Chart Explanation: A bar chart showing the year-to-date flow and remaining flow of net overseas purchases of US Treasuries from 2015 to 2026. Significant fluctuations in funds were observed, with a marked decline in 2020 and a peak in 2022. While net purchases are still positive year-to-date in 2026, they are lower than recent levels. Data Source: US Treasury Department, Harvard Analysis, statistics as of May 31, 2026. We note that the recent decline in net purchases of US Treasuries is mainly due to a significant contraction in purchases by official institutions, which typically include central banks, foreign exchange reserve management departments, and sovereign wealth funds. As of May, official institutions had accumulated only $6 billion in net purchases since the beginning of the year; in contrast, net purchases by the overseas private sector reached $165 billion (see Figure 3), although both sectors are experiencing a downward trend in their purchases. The driving factors behind this capital outflow are still uncertain, but the most reasonable explanation is that rising sovereign bond yields in other global economies allow for a more effective diversion of domestic funds. Figure 3: Net purchases of US Treasuries by both official and private sectors have declined. Chart Description: This is a stacked bar chart with two columns, showing net purchases of US Treasuries by overseas official and private investors from 2023 to 2026. Official sector purchases declined sharply after 2024, reaching extremely low levels in 2026; private sector purchases remained positive in 2026, but were lower than the levels seen from 2023 to 2025. Data Source: US Treasury Department, Harvard Analysis, statistics as of May 31, 2026. The most typical observable case of investors shifting from US Treasuries to other competitive sovereign bonds is most likely occurring in Japan. The yield on 10-year Japanese government bonds has climbed to a multi-decade high; after accounting for exchange rate hedging costs, this yield has consistently been higher than that of US Treasuries of the same maturity (see Figure 4). Figure 4: After exchange rate hedging adjustments, the yield on 10-year Japanese government bonds is higher than that of US Treasuries of the same maturity. Chart Explanation: A line comparison of the 10-year Japanese government bond yield and the 10-year US Treasury yield after currency hedging, from 2010 to 2026. Japanese bond yields declined steadily in the late 2010s, then rose significantly after 2022; by 2026, Japanese bond yields had exceeded the positive return of US Treasuries after hedging costs. Data Source: Bloomberg, statistics as of July 29, 2026; hedging costs are based on a 3-month rolling calculation combined with Bank of Japan data (Figure 5). From the beginning of 2026 to May, Japanese investors became net sellers of long-term US debt. The Bank of Japan did not separate corporate bond and sovereign bond trading data, but based on US TIC cross-border capital flows data, it is reasonable to infer that net selling was mainly concentrated on US Treasuries. Figure 5: Since 2026, Japanese investors have become net sellers of long-term US bonds. Chart Explanation: Bar chart showing net buying and selling of US long-term bonds by Japanese investors from 2015 to 2026. Funds alternate between net buying and net selling, with the largest net selling in 2022 and the highest net buying in 2023; since the beginning of 2026 , the market has been in a net selling state. Data source: Bank of Japan, Harvard Analysis, statistics as of May 31, 2026. Despite the aforementioned changes in fund flows in the Japanese market, global demand for US assets remains generally stable. Further evidence is the absence of large-scale synchronized selling. So far in 2026, only about 2% of trading days within a 5-day rolling range have seen simultaneous declines in three major asset classes—10-year US Treasury bonds, US investment-grade corporate bond spreads (represented by the Bloomberg US Corporate Bond Total Return Index), and the US dollar index. If the market truly loses confidence in the "unique advantages of US assets," such synchronized selling should become more frequent. Looking back at April 2025, in the short term following the release of news related to "Liberation Day," US Treasuries, credit spreads, and the US dollar did indeed experience a synchronized unfavorable market trend. However, afterward, the traditional correlation between various assets largely returned to normal. This means that the market shock brought about by "Liberation Day" was merely a short-term liquidity misalignment, not a fundamental shift in the long-term market structure. Equally crucial is that when geopolitical conflicts or other risks trigger widespread market turmoil, the US dollar and US Treasuries continue to exhibit their safe-haven asset characteristics. Once risk assets come under pressure, US Treasury yields typically decline, or the US dollar receives financial support. Of course, US Treasuries do not always fulfill their hedging role as intended. For example, when market shocks cause sharp fluctuations in inflation expectations, their safe-haven effect is diminished. Even so, in such environments, US Treasuries often outperform other G10 sovereign bonds. Furthermore, even during periods when long-term US Treasury yields rise and investment-grade credit spreads widen (such as in the early stages of the Iranian conflict this March), the US dollar mostly strengthens. This indicates that investors remain willing to allocate to US assets in the face of global tensions and uncertainties. Overall, global demand for US assets may have declined somewhat compared to previous years, but the absolute scale remains considerable. The aforementioned trends highlight the value of in-depth analysis: fundamentals, capital flows, and relative returns are all indispensable. Our research shows that US assets continue to attract global capital, while also supporting a globalized allocation strategy in the bond market—attractive yield opportunities exist in multiple regions globally. With continued divergence in economic growth, inflation, and monetary policies across countries, diversification in the global fixed-income market is expected to enhance portfolio resilience.
- Risk Warning and Disclaimer
- The market involves risk, and trading may not be suitable for all investors. This article is for reference only and does not constitute personal investment advice, nor does it take into account certain users’ specific investment objectives, financial situation, or other needs. Any investment decisions made based on this information are at your own risk.