A chart shows that the Baltic Dry Index halted its five-day winning streak, freight rates diverged significantly across vessel types, highlighting the market's structural characteristics.
2026-08-06 22:40:02
The latest data shows that the Baltic Dry Index (BDI) was 3057 points on August 6, 2026, a decrease of 0.20% compared to the previous period, marking the largest drop since July 29, 2026. Looking at the short-term charts, the BDI has seen positive growth 7 times, negative growth 4 times, and zero growth in the last 11 BDI readings. Specifically, the Panamax Freight Index (BPI) was 2275 points, up 1.74% from the previous period; the Capesize Freight Index (BCI) was 5052 points, down 0.82%; and the Supramax Freight Index (BSI) was 1608 points, down 0.25%. For detailed charts of the Baltic Dry Index and its three main sub-indices, including the latest 720-day and 10-year trends, please refer to the charts specially created by FX678. 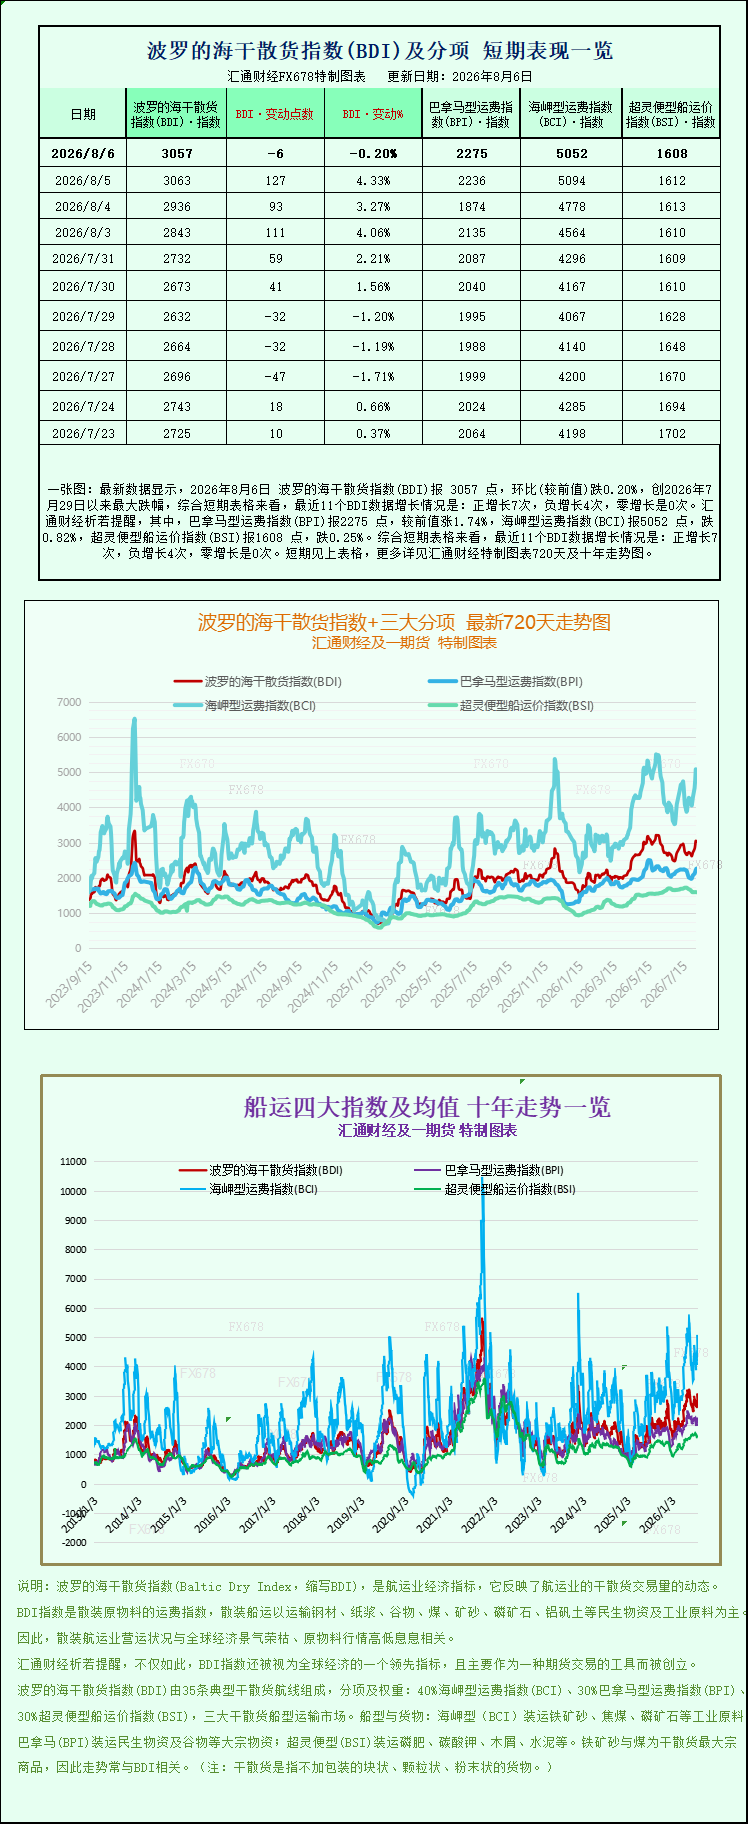 On August 6, 2026, the Baltic Dry Index (BDI) released its latest dry bulk freight data, showing a slight decline and ending a five-day winning streak. This correction did not reflect a general market weakness, but rather a clear structural divergence: Capesize and Supramax freight rates fell simultaneously, while Panamax rates bucked the trend and strengthened. These two opposing forces ultimately led to a slight decrease in the overall index, directly reflecting the uneven demand in the global dry bulk shipping market. The Baltic Dry Index fell 6 points, or 0.2%, to close at 3057 points. The index remains within the relatively high range since June 4th, and the bullish momentum accumulated over the five-day rally has only seen a slight correction, with no overall downward trend in the market. Industry insiders generally believe that the Baltic Dry Index (BDI) is calculated by weighting the freight rates of three major bulk carrier types—Capesize, Panamax, and Supramax—with fixed weights. It comprehensively covers major global dry bulk shipping categories such as iron ore, coal, grain, and minor building materials, making it a core leading indicator for observing global demand for industrial, infrastructure, and agricultural commodities. Short-term fluctuations in the index often correspond to supply-demand mismatches in specific cargo types and shipping routes. Looking at the current market trend, the market has been rising for the past five trading days, primarily driven by a recovery in demand for Capesize iron ore shipping, coupled with support from small and medium-sized cargoes during the peak global grain export season. The market reversal on the 6th was due to a temporary slowdown in the release of cargoes from large Capesize vessels, leading to downward pressure on charter rates and dragging down the overall index performance. Breaking down the daily freight rate data by vessel type clearly reveals the market's divergent patterns. The Capesize index, the mainstay of iron ore transportation, fell sharply by 42 points, a drop of 0.8%, closing at 5052 points. This is the first single-day decline since the index began its upward trend on July 29. Capesize bulk carriers generally have a deadweight tonnage of over 150,000 tons, and more than 75% of global transoceanic iron ore trade relies on this type of vessel. They also handle long-haul thermal coal transportation. Freight rate fluctuations are highly correlated with the demand from China's steel industry, exhibiting the most volatile fluctuations among the three vessel types. Data shows that on that day, the average daily operating revenue of Capesize vessels on the five core routes decreased by $385 to $42,313 per day, resulting in a slight reduction in daily profits for shipowners. The short-term weakening of freight rates is mainly due to the partial closing of the concentrated shipping window from overseas mines in late July to early August. Long-haul iron ore cargoes from Brazil and Australia to China decreased, port ore inventories awaiting loading declined slightly, charterer inquiries cooled, and shipowners' bargaining power weakened, naturally putting downward pressure on charter rates. It's worth noting that despite the short-term weakening of Capesize freight rates, sentiment in the iron ore futures market did not cool accordingly. On August 6th, iron ore futures continued their upward trend, driven primarily by improved expectations regarding domestic real estate policies. Market news indicates that Beijing may introduce a new round of supportive policies for the real estate industry, covering multiple dimensions such as financing for real estate companies, stimulating housing demand, and mitigating existing risks, significantly boosting market optimism regarding the recovery of domestic steel consumption. Real estate is the largest downstream consumption scenario for steel; relaxed real estate policies will directly drive a recovery in steel demand from new construction starts and the construction sector, thereby boosting steel mills' willingness to replenish inventory and providing long-term support for iron ore import demand and Capesize vessel cargo volume. The short-term freight rate correction is more of a technical adjustment after continuous increases. In the medium to long term, the market maintains stable and optimistic expectations for seaborne iron ore demand, which also prevented a deep decline in the Capesize index, resulting in only a slight pullback. In stark contrast to Capesize, Panamax vessel freight rates strengthened across the board on the same day, becoming the core pillar supporting the BDI index and preventing a significant drop. The Panamax index rose 39 points, or 1.7%, to close at 2275 points, a near two-month high since June 15. This vessel type, with a deadweight range of 60,000 to 70,000 tons, primarily transports transoceanic coal, soybeans, corn, and other grains, while also handling regional industrial raw material transport. Its routes cover two core routes: the Pacific grain export route and the Eurasian coal trade route. The average daily charter rate for Panamax vessels rose by $345 to $20,473 per day, driven by the continued global grain export cycle and rigid demand in energy trade. While the peak soybean export season in Brazil is nearing its end, corn shipments continue to increase, and North American grain loading remains stable. Meanwhile, power plants in many Asian countries maintain rigid coal import purchases due to peak summer demand, leading to a continuous release of long-haul coal cargoes. The market's available Panamax capacity is relatively tight, pushing charter rates higher. Coupled with the stable operation of the Panama Canal and smooth route turnover, this further amplifies the potential for increased Panamax freight rates. The market for small and medium-sized vessels also weakened, with the Supramax index falling 4 points, or 0.3%, to close at 1608. Supramax vessels, with a deadweight to 40,000-60,000 tons, shallow draft, and equipped with their own loading and unloading equipment, can berth at small and medium-sized feeder ports. They transport small batches of bulk cargo such as coal, grain, steel, and bauxite. Their fleet accounts for over 60% of the global dry bulk fleet, covering regional feeder and short-haul transportation markets. Freight rates are relatively stable, but saw a slight correction due to the overall off-season demand for small and medium-sized bulk cargoes. Entering August, high temperatures in the Northern Hemisphere affected grain storage and turnover, leading to a decrease in large-volume ocean-going grain orders as buyers adopted a piecemeal purchasing model. Simultaneously, regional activity in building materials and minor mineral products trade declined, resulting in insufficient feeder cargo release. This, coupled with the continued influx of newly delivered small and medium-sized bulk carriers into the market, created ample supply of shipping capacity in some regions, all of which suppressed Supramax charter rates. In summary, the Baltic Dry Index's halt to its five-day winning streak on August 6th was a result of a temporary mismatch between supply and demand for specific cargo types and routes, rather than a reversal of the global dry bulk market trend. The current market exhibits a structural pattern: large vessels are experiencing a short-term correction, medium-sized vessels are providing strong support, and small vessels are showing moderate weakness. Capesize vessels are being dragged down by a short-term slowdown in ore cargoes, but expectations of domestic real estate stimulus policies provide long-term support for iron ore demand. Panamax vessels continue to strengthen due to rigid global import demand for grain and coal, acting as a market stabilizer. Supramax vessels are facing slight pressure due to the off-season for feeder bulk cargoes. Looking ahead, the dry bulk shipping market will likely maintain a volatile and differentiated pattern. In the short term, the focus will be on the pace of implementation of domestic real estate support policies. If the policy力度 (strength/intensity) exceeds expectations, steel mill restocking demand will rebound rapidly, driving Capesize freight rates back into an upward trend. Regarding grain, the shipping schedules from South and North America will continue to influence Panamax charter rates. The recovery of the Supramax market will depend on a recovery in global industrial raw material and feeder trade demand. In addition, variables such as international fuel prices, overseas mining shipment plans, new ship delivery schedules, and geopolitical conflicts in the Middle East will continue to disrupt freight rate fluctuations across different ship types. The Baltic Dry Index is likely to continue its high-level fluctuations, and market differentiation among different ship types will remain the norm.
On August 6, 2026, the Baltic Dry Index (BDI) released its latest dry bulk freight data, showing a slight decline and ending a five-day winning streak. This correction did not reflect a general market weakness, but rather a clear structural divergence: Capesize and Supramax freight rates fell simultaneously, while Panamax rates bucked the trend and strengthened. These two opposing forces ultimately led to a slight decrease in the overall index, directly reflecting the uneven demand in the global dry bulk shipping market. The Baltic Dry Index fell 6 points, or 0.2%, to close at 3057 points. The index remains within the relatively high range since June 4th, and the bullish momentum accumulated over the five-day rally has only seen a slight correction, with no overall downward trend in the market. Industry insiders generally believe that the Baltic Dry Index (BDI) is calculated by weighting the freight rates of three major bulk carrier types—Capesize, Panamax, and Supramax—with fixed weights. It comprehensively covers major global dry bulk shipping categories such as iron ore, coal, grain, and minor building materials, making it a core leading indicator for observing global demand for industrial, infrastructure, and agricultural commodities. Short-term fluctuations in the index often correspond to supply-demand mismatches in specific cargo types and shipping routes. Looking at the current market trend, the market has been rising for the past five trading days, primarily driven by a recovery in demand for Capesize iron ore shipping, coupled with support from small and medium-sized cargoes during the peak global grain export season. The market reversal on the 6th was due to a temporary slowdown in the release of cargoes from large Capesize vessels, leading to downward pressure on charter rates and dragging down the overall index performance. Breaking down the daily freight rate data by vessel type clearly reveals the market's divergent patterns. The Capesize index, the mainstay of iron ore transportation, fell sharply by 42 points, a drop of 0.8%, closing at 5052 points. This is the first single-day decline since the index began its upward trend on July 29. Capesize bulk carriers generally have a deadweight tonnage of over 150,000 tons, and more than 75% of global transoceanic iron ore trade relies on this type of vessel. They also handle long-haul thermal coal transportation. Freight rate fluctuations are highly correlated with the demand from China's steel industry, exhibiting the most volatile fluctuations among the three vessel types. Data shows that on that day, the average daily operating revenue of Capesize vessels on the five core routes decreased by $385 to $42,313 per day, resulting in a slight reduction in daily profits for shipowners. The short-term weakening of freight rates is mainly due to the partial closing of the concentrated shipping window from overseas mines in late July to early August. Long-haul iron ore cargoes from Brazil and Australia to China decreased, port ore inventories awaiting loading declined slightly, charterer inquiries cooled, and shipowners' bargaining power weakened, naturally putting downward pressure on charter rates. It's worth noting that despite the short-term weakening of Capesize freight rates, sentiment in the iron ore futures market did not cool accordingly. On August 6th, iron ore futures continued their upward trend, driven primarily by improved expectations regarding domestic real estate policies. Market news indicates that Beijing may introduce a new round of supportive policies for the real estate industry, covering multiple dimensions such as financing for real estate companies, stimulating housing demand, and mitigating existing risks, significantly boosting market optimism regarding the recovery of domestic steel consumption. Real estate is the largest downstream consumption scenario for steel; relaxed real estate policies will directly drive a recovery in steel demand from new construction starts and the construction sector, thereby boosting steel mills' willingness to replenish inventory and providing long-term support for iron ore import demand and Capesize vessel cargo volume. The short-term freight rate correction is more of a technical adjustment after continuous increases. In the medium to long term, the market maintains stable and optimistic expectations for seaborne iron ore demand, which also prevented a deep decline in the Capesize index, resulting in only a slight pullback. In stark contrast to Capesize, Panamax vessel freight rates strengthened across the board on the same day, becoming the core pillar supporting the BDI index and preventing a significant drop. The Panamax index rose 39 points, or 1.7%, to close at 2275 points, a near two-month high since June 15. This vessel type, with a deadweight range of 60,000 to 70,000 tons, primarily transports transoceanic coal, soybeans, corn, and other grains, while also handling regional industrial raw material transport. Its routes cover two core routes: the Pacific grain export route and the Eurasian coal trade route. The average daily charter rate for Panamax vessels rose by $345 to $20,473 per day, driven by the continued global grain export cycle and rigid demand in energy trade. While the peak soybean export season in Brazil is nearing its end, corn shipments continue to increase, and North American grain loading remains stable. Meanwhile, power plants in many Asian countries maintain rigid coal import purchases due to peak summer demand, leading to a continuous release of long-haul coal cargoes. The market's available Panamax capacity is relatively tight, pushing charter rates higher. Coupled with the stable operation of the Panama Canal and smooth route turnover, this further amplifies the potential for increased Panamax freight rates. The market for small and medium-sized vessels also weakened, with the Supramax index falling 4 points, or 0.3%, to close at 1608. Supramax vessels, with a deadweight to 40,000-60,000 tons, shallow draft, and equipped with their own loading and unloading equipment, can berth at small and medium-sized feeder ports. They transport small batches of bulk cargo such as coal, grain, steel, and bauxite. Their fleet accounts for over 60% of the global dry bulk fleet, covering regional feeder and short-haul transportation markets. Freight rates are relatively stable, but saw a slight correction due to the overall off-season demand for small and medium-sized bulk cargoes. Entering August, high temperatures in the Northern Hemisphere affected grain storage and turnover, leading to a decrease in large-volume ocean-going grain orders as buyers adopted a piecemeal purchasing model. Simultaneously, regional activity in building materials and minor mineral products trade declined, resulting in insufficient feeder cargo release. This, coupled with the continued influx of newly delivered small and medium-sized bulk carriers into the market, created ample supply of shipping capacity in some regions, all of which suppressed Supramax charter rates. In summary, the Baltic Dry Index's halt to its five-day winning streak on August 6th was a result of a temporary mismatch between supply and demand for specific cargo types and routes, rather than a reversal of the global dry bulk market trend. The current market exhibits a structural pattern: large vessels are experiencing a short-term correction, medium-sized vessels are providing strong support, and small vessels are showing moderate weakness. Capesize vessels are being dragged down by a short-term slowdown in ore cargoes, but expectations of domestic real estate stimulus policies provide long-term support for iron ore demand. Panamax vessels continue to strengthen due to rigid global import demand for grain and coal, acting as a market stabilizer. Supramax vessels are facing slight pressure due to the off-season for feeder bulk cargoes. Looking ahead, the dry bulk shipping market will likely maintain a volatile and differentiated pattern. In the short term, the focus will be on the pace of implementation of domestic real estate support policies. If the policy力度 (strength/intensity) exceeds expectations, steel mill restocking demand will rebound rapidly, driving Capesize freight rates back into an upward trend. Regarding grain, the shipping schedules from South and North America will continue to influence Panamax charter rates. The recovery of the Supramax market will depend on a recovery in global industrial raw material and feeder trade demand. In addition, variables such as international fuel prices, overseas mining shipment plans, new ship delivery schedules, and geopolitical conflicts in the Middle East will continue to disrupt freight rate fluctuations across different ship types. The Baltic Dry Index is likely to continue its high-level fluctuations, and market differentiation among different ship types will remain the norm.
- Risk Warning and Disclaimer
- The market involves risk, and trading may not be suitable for all investors. This article is for reference only and does not constitute personal investment advice, nor does it take into account certain users’ specific investment objectives, financial situation, or other needs. Any investment decisions made based on this information are at your own risk.