Gold and silver prices surged and broke through resistance levels, with the market entering a rare strong uptrend.
2026-08-11 18:14:54
Gold and silver prices surged over the past week, with the magnitude of the gains far exceeding the typical fluctuations predicted by traditional macroeconomic indicators. The current key market debate centers on whether this is merely a bear market rally or the beginning of a sustained upward trend, potentially returning to the January highs.  The negative pressure from the macroeconomic environment has subsided. This round of price breakout coincided with a warming macroeconomic environment, allowing precious metals to experience a concentrated release of pressure after a prolonged period of downturn. Affected by the yen's currency intervention, the US dollar index has fallen by approximately 1.7% from its late July high; the yields on 2-year and 10-year US Treasury bonds have also declined from their recent peaks. The decline in the 2-year yield is mainly due to the market lowering its expectations for aggressive rate hikes following the Fed's July meeting.
 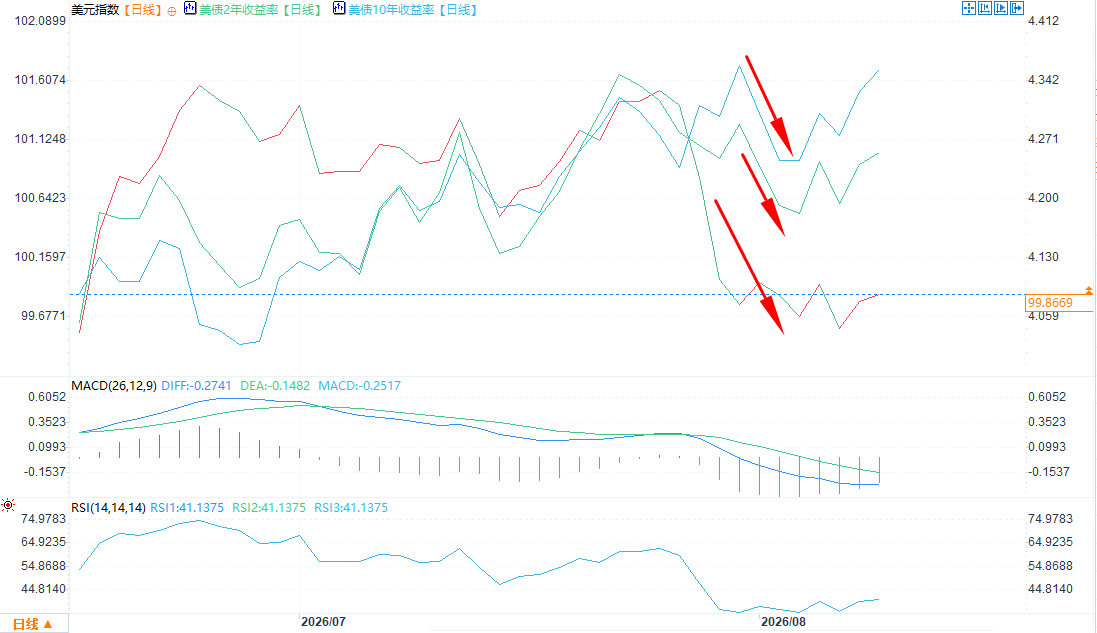 While there is still debate about whether the US dollar and US Treasury yields have peaked, their simultaneous weakening has undoubtedly fueled the surge in precious metal prices. The negative correlation between gold and silver and the US dollar has significantly strengthened . As can be seen from the correlation data below, both gold and silver maintain a mild negative correlation with the US dollar index and US Treasury yields; and in the past two months, the degree of this negative correlation has deepened significantly compared to the long-term average.
 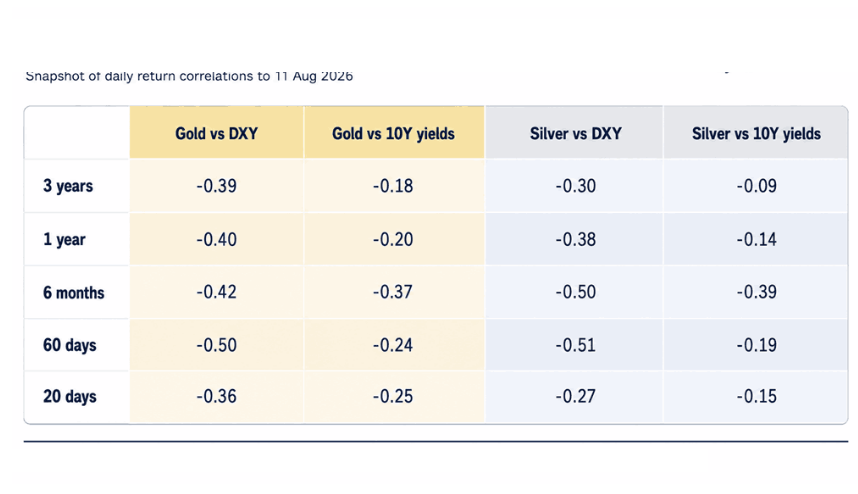 Over the past 60 trading days, the correlation coefficient between gold and the US Dollar Index (DXY) was -0.50, while that for silver was -0.51. Their three-year long-term correlation coefficients were only -0.39 and -0.30, respectively. Gold and silver also showed a negative correlation with the 10-year US Treasury yield, but the correlation was weaker, with gold at -0.24 and silver at only -0.19 over the 60-day period. The traditional macroeconomic linkage logic remains unchanged, but the unique aspect of this round of market movement lies not in the direction of price increases or decreases, but in the unprecedented magnitude of the rise. Gold and silver have experienced a historically rare surge . Compared to the historical patterns of gold and silver fluctuating with the US dollar and US Treasury yields over the past three years and the same five-day trading period, the magnitude of this surge is extreme. In the past five trading days, gold has risen by a cumulative 8.6%; while according to macroeconomic models, the theoretical increase during the same period was only 0.5%. This increase, adjusted for macroeconomic factors, ranks at the 99.9th percentile among all five-day market movements in the past three years, making it an extremely rare occurrence. Silver's gains were even more dramatic, rising 11.2% in five days, compared to a theoretical theoretical increase of only 0.9% based on model calculations. This revised increase places it at the 96.4th percentile of its three-year performance. Whether driven by a breakout from a prolonged period of consolidation, widespread bets on a temporary peak in the US dollar and US Treasury yields, or other factors, this round of gold and silver price increases is highly unusual. The next target for gold bulls: the 200-day moving average.
 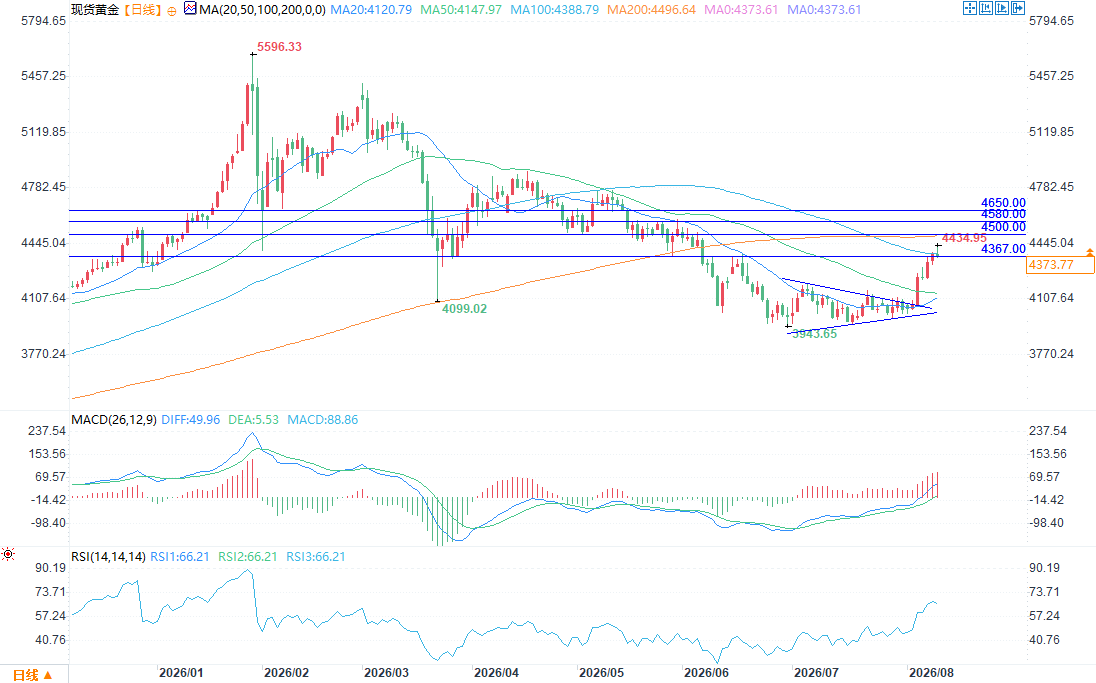 Gold's first resistance level is $4367/oz, a price level that previously served as both support and resistance. As shown in the chart, gold prices broke strongly through this level on Monday evening, touching the 100-day moving average, and extended their gains again today. $4367 and the 100-day moving average have now become key short-term support; the next key resistance level is the 200-day moving average, corresponding to the psychological key price level of $4500/oz. The 14-period Relative Strength Index (RSI) continues to hold above 50, indicating accumulating upward momentum; the MACD indicator has formed a bullish golden cross and turned positive, both signals supporting buying on dips and following the trend, rather than shorting to speculate on pullbacks. Trading strategy: Buy gold on pullbacks to the 100-day moving average or the $4367 range, with stop-loss orders placed below support levels to mitigate the risk of a reversal. Initial targets are the 200-day moving average, $4580, $4650, and $4775, all of which have acted as resistance levels multiple times this year. If gold prices fall below $4367 again, the bullish trend will be questionable, and the market will likely enter a range-bound trading pattern, significantly reducing the likelihood of a continued upward breakout. Silver has broken out, with $71 now within its target range.
 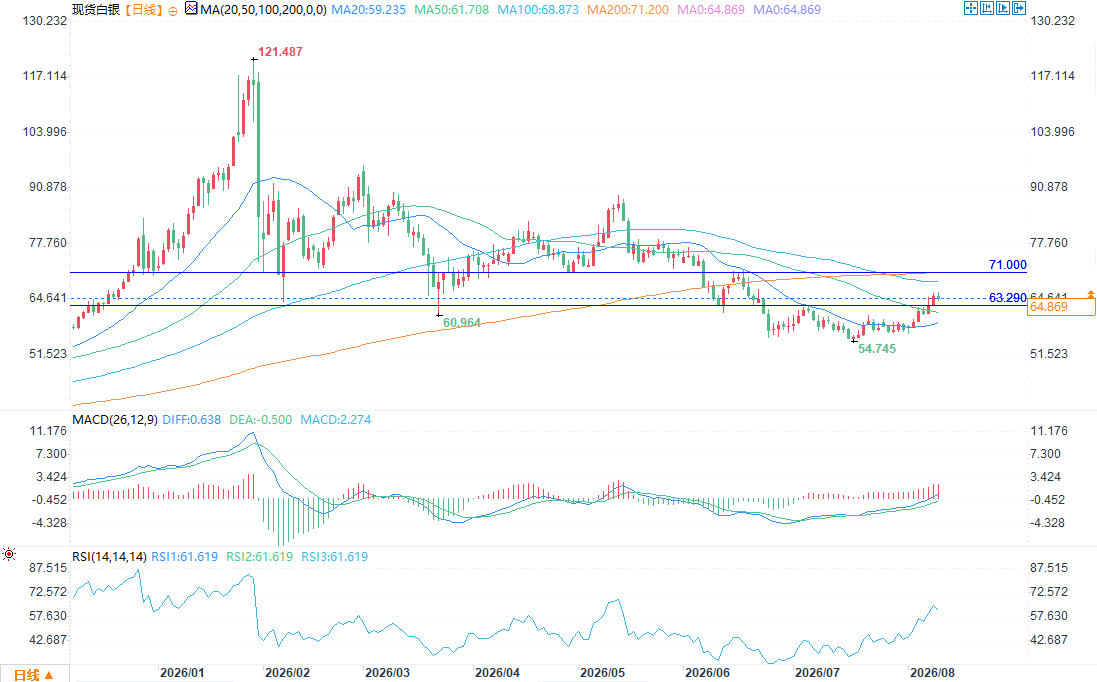 While the visual impact of silver's price increase wasn't as dramatic as gold's, silver broke through three resistance levels this week: the 50-day moving average, the long-term downtrend line extending from the year's all-time high, and the $63.29 resistance level. Since then, silver prices have continued to rise, now approaching the $67 resistance level. These two price levels have become the core observation range for silver in the short term. Oscillators are all releasing bullish signals: the 14-period RSI has risen to 62, continuing to rise but not yet entering overbought territory; the MACD has also formed a bullish golden cross and turned positive, indicating continued strengthening upward momentum. The strategy is to buy on dips and follow the breakout. Trading Strategy: Buy silver on a pullback to $63.29, with a stop-loss order placed below this price level, the downtrend line from the January high, or the 50-day moving average. Investors can choose the stop-loss position based on their risk-reward ratio. If silver prices do not retrace and directly stabilize above $67, another long position can be taken, with a stop-loss order placed below $67. The upside targets are the 100-day moving average and $71; the 200-day moving average falls precisely at $71, a level that repeatedly suppressed silver prices in June. A decisive break above the 200-day moving average would be significant. This current rally began within a long-term descending wedge pattern. Although the upper and lower rails of the wedge were only tested at a few points, and the pattern is not considered standard, it still suggests the possibility of a resumption of the major bullish trend seen in the first half of this year.
The negative pressure from the macroeconomic environment has subsided. This round of price breakout coincided with a warming macroeconomic environment, allowing precious metals to experience a concentrated release of pressure after a prolonged period of downturn. Affected by the yen's currency intervention, the US dollar index has fallen by approximately 1.7% from its late July high; the yields on 2-year and 10-year US Treasury bonds have also declined from their recent peaks. The decline in the 2-year yield is mainly due to the market lowering its expectations for aggressive rate hikes following the Fed's July meeting. While there is still debate about whether the US dollar and US Treasury yields have peaked, their simultaneous weakening has undoubtedly fueled the surge in precious metal prices. The negative correlation between gold and silver and the US dollar has significantly strengthened . As can be seen from the correlation data below, both gold and silver maintain a mild negative correlation with the US dollar index and US Treasury yields; and in the past two months, the degree of this negative correlation has deepened significantly compared to the long-term average. Over the past 60 trading days, the correlation coefficient between gold and the US Dollar Index (DXY) was -0.50, while that for silver was -0.51. Their three-year long-term correlation coefficients were only -0.39 and -0.30, respectively. Gold and silver also showed a negative correlation with the 10-year US Treasury yield, but the correlation was weaker, with gold at -0.24 and silver at only -0.19 over the 60-day period. The traditional macroeconomic linkage logic remains unchanged, but the unique aspect of this round of market movement lies not in the direction of price increases or decreases, but in the unprecedented magnitude of the rise. Gold and silver have experienced a historically rare surge . Compared to the historical patterns of gold and silver fluctuating with the US dollar and US Treasury yields over the past three years and the same five-day trading period, the magnitude of this surge is extreme. In the past five trading days, gold has risen by a cumulative 8.6%; while according to macroeconomic models, the theoretical increase during the same period was only 0.5%. This increase, adjusted for macroeconomic factors, ranks at the 99.9th percentile among all five-day market movements in the past three years, making it an extremely rare occurrence. Silver's gains were even more dramatic, rising 11.2% in five days, compared to a theoretical theoretical increase of only 0.9% based on model calculations. This revised increase places it at the 96.4th percentile of its three-year performance. Whether driven by a breakout from a prolonged period of consolidation, widespread bets on a temporary peak in the US dollar and US Treasury yields, or other factors, this round of gold and silver price increases is highly unusual. The next target for gold bulls: the 200-day moving average. Gold's first resistance level is $4367/oz, a price level that previously served as both support and resistance. As shown in the chart, gold prices broke strongly through this level on Monday evening, touching the 100-day moving average, and extended their gains again today. $4367 and the 100-day moving average have now become key short-term support; the next key resistance level is the 200-day moving average, corresponding to the psychological key price level of $4500/oz. The 14-period Relative Strength Index (RSI) continues to hold above 50, indicating accumulating upward momentum; the MACD indicator has formed a bullish golden cross and turned positive, both signals supporting buying on dips and following the trend, rather than shorting to speculate on pullbacks. Trading strategy: Buy gold on pullbacks to the 100-day moving average or the $4367 range, with stop-loss orders placed below support levels to mitigate the risk of a reversal. Initial targets are the 200-day moving average, $4580, $4650, and $4775, all of which have acted as resistance levels multiple times this year. If gold prices fall below $4367 again, the bullish trend will be questionable, and the market will likely enter a range-bound trading pattern, significantly reducing the likelihood of a continued upward breakout. Silver has broken out, with $71 now within its target range. While the visual impact of silver's price increase wasn't as dramatic as gold's, silver broke through three resistance levels this week: the 50-day moving average, the long-term downtrend line extending from the year's all-time high, and the $63.29 resistance level. Since then, silver prices have continued to rise, now approaching the $67 resistance level. These two price levels have become the core observation range for silver in the short term. Oscillators are all releasing bullish signals: the 14-period RSI has risen to 62, continuing to rise but not yet entering overbought territory; the MACD has also formed a bullish golden cross and turned positive, indicating continued strengthening upward momentum. The strategy is to buy on dips and follow the breakout. Trading Strategy: Buy silver on a pullback to $63.29, with a stop-loss order placed below this price level, the downtrend line from the January high, or the 50-day moving average. Investors can choose the stop-loss position based on their risk-reward ratio. If silver prices do not retrace and directly stabilize above $67, another long position can be taken, with a stop-loss order placed below $67. The upside targets are the 100-day moving average and $71; the 200-day moving average falls precisely at $71, a level that repeatedly suppressed silver prices in June. A decisive break above the 200-day moving average would be significant. This current rally began within a long-term descending wedge pattern. Although the upper and lower rails of the wedge were only tested at a few points, and the pattern is not considered standard, it still suggests the possibility of a resumption of the major bullish trend seen in the first half of this year.
- Risk Warning and Disclaimer
- The market involves risk, and trading may not be suitable for all investors. This article is for reference only and does not constitute personal investment advice, nor does it take into account certain users’ specific investment objectives, financial situation, or other needs. Any investment decisions made based on this information are at your own risk.