The repercussions of foreign exchange market intervention have not yet subsided, and the pricing mechanism for the USD/JPY exchange rate has already changed.
2026-08-12 17:58:57
On Wednesday, August 12th, the USD/JPY pair was fluctuating around 159, having traded between 158.6 and 159.4 during the day. This indicates that the rapid volatility caused by previous market intervention has partially subsided, but the exchange rate remains in a highly volatile environment. Currently, the market's pricing is not truly determined by a single technical indicator, but rather by the re-alignment between the Fed's September policy expectations, the Bank of Japan's policy normalization pace, and the latest inflation data. The US July jobs report is a significant reason for the recent fluctuations in dollar pricing. The latest official data shows that non-farm payrolls decreased by 23,000 in July, compared to an average monthly increase of 34,000 over the past 12 months; meanwhile, the unemployment rate fell from 4.2% to 4.1%. The job decline was mainly concentrated in local government, education, and retail sectors, while healthcare employment continued to grow. The key to this data is not just the negative non-farm payroll total, but the fact that the information released by the business survey and the household survey is not entirely consistent. Non-farm payrolls reflect a weakening of new job creation in the business sector, but the decline in the unemployment rate means that the labor market has not yet experienced the rapid expansion of unemployment typically seen during a recession. For the interest rate market, this structure is more complex than simply the non-farm payroll figure.  Therefore, the market initially lowered its tightening expectations after the jobs report was released, and then reassessed the employment composition and unemployment rate. Currently, the market's pricing in a September Fed policy adjustment is roughly 50/50. This explains why the dollar was able to recover some of the volatility following the jobs report release, rather than forming a sustained one-way trend. It's worth noting that the Fed maintained its federal funds target range at 3.50% to 3.75% at its July meeting. Fed Chairman Warsh emphasized at the time that employment and inflation remain the core of policy decisions, meaning that a single month's jobs data is insufficient to independently determine the September policy choice. Previously, the US June Consumer Price Index (CPI) fell 0.4% month-on-month and rose 3.5% year-on-year; the core CPI, excluding food and energy, was flat month-on-month and rose 2.6% year-on-year. The mainstream market expectation for July's data is a CPI increase of approximately 0.1% month-on-month and 3.4% year-on-year, and a core CPI increase of approximately 0.2% month-on-month and 2.5% year-on-year. For the market, what's more important is how the data changes the interest rate distribution, rather than simply judging whether a particular number is "good" or "bad." If core inflation shows renewed stickiness, the market will need to recalculate how long policy rates will remain high; if core price pressures continue to ease, the pricing of the necessity for tightening will also be re-examined. Therefore, the key focus of this data analysis is the spread of core service prices, housing costs, and commodity inflation. Monthly overall indices are easily affected by energy items, while policymakers are more concerned with whether inflation is spreading from a few items to a wider range of categories. Another key variable in the current USD/JPY structure comes from the Bank of Japan. On July 31, the Bank of Japan voted 8-1 to maintain the target for the unsecured overnight call rate at approximately 1.0%, but a member advocated for an increase to 1.25%, which was not passed. This indicates that there is now clearer discussion within the committee about further normalization. The Bank of Japan's next monetary policy meeting is scheduled for September 17-18. The latest market pricing has significantly increased the probability of a policy adjustment in September, with the market reflecting nearly two-thirds of the probability in some overnight rates. Recent intervention in the foreign exchange market has altered the short-term volatility structure of the USD/JPY pair. However, from a financial perspective, the intervention primarily affects liquidity, positioning, and short-term price disorder, and cannot permanently change the interest rate differential framework between the two currencies. For the Bank of Japan to achieve a more stable macroeconomic foundation for its intervention, the market will ultimately observe changes in the actual policy rate, inflation expectations, and long-term government bond yields. This is the biggest difference between the current USD/JPY pair and the past phase of simple carry trades. The market needs to price in both the intervention risk and the probability of policy normalization, adding the risk of policy jumps to the existing holding costs. Looking at the daily chart, the USD/JPY pair previously formed a high near 163 before quickly falling back, briefly approaching the 155 area, and then returning to around 159. The current price remains below the Bollinger Band's middle band and has moved away from the extreme volatility zone near the lower band.
 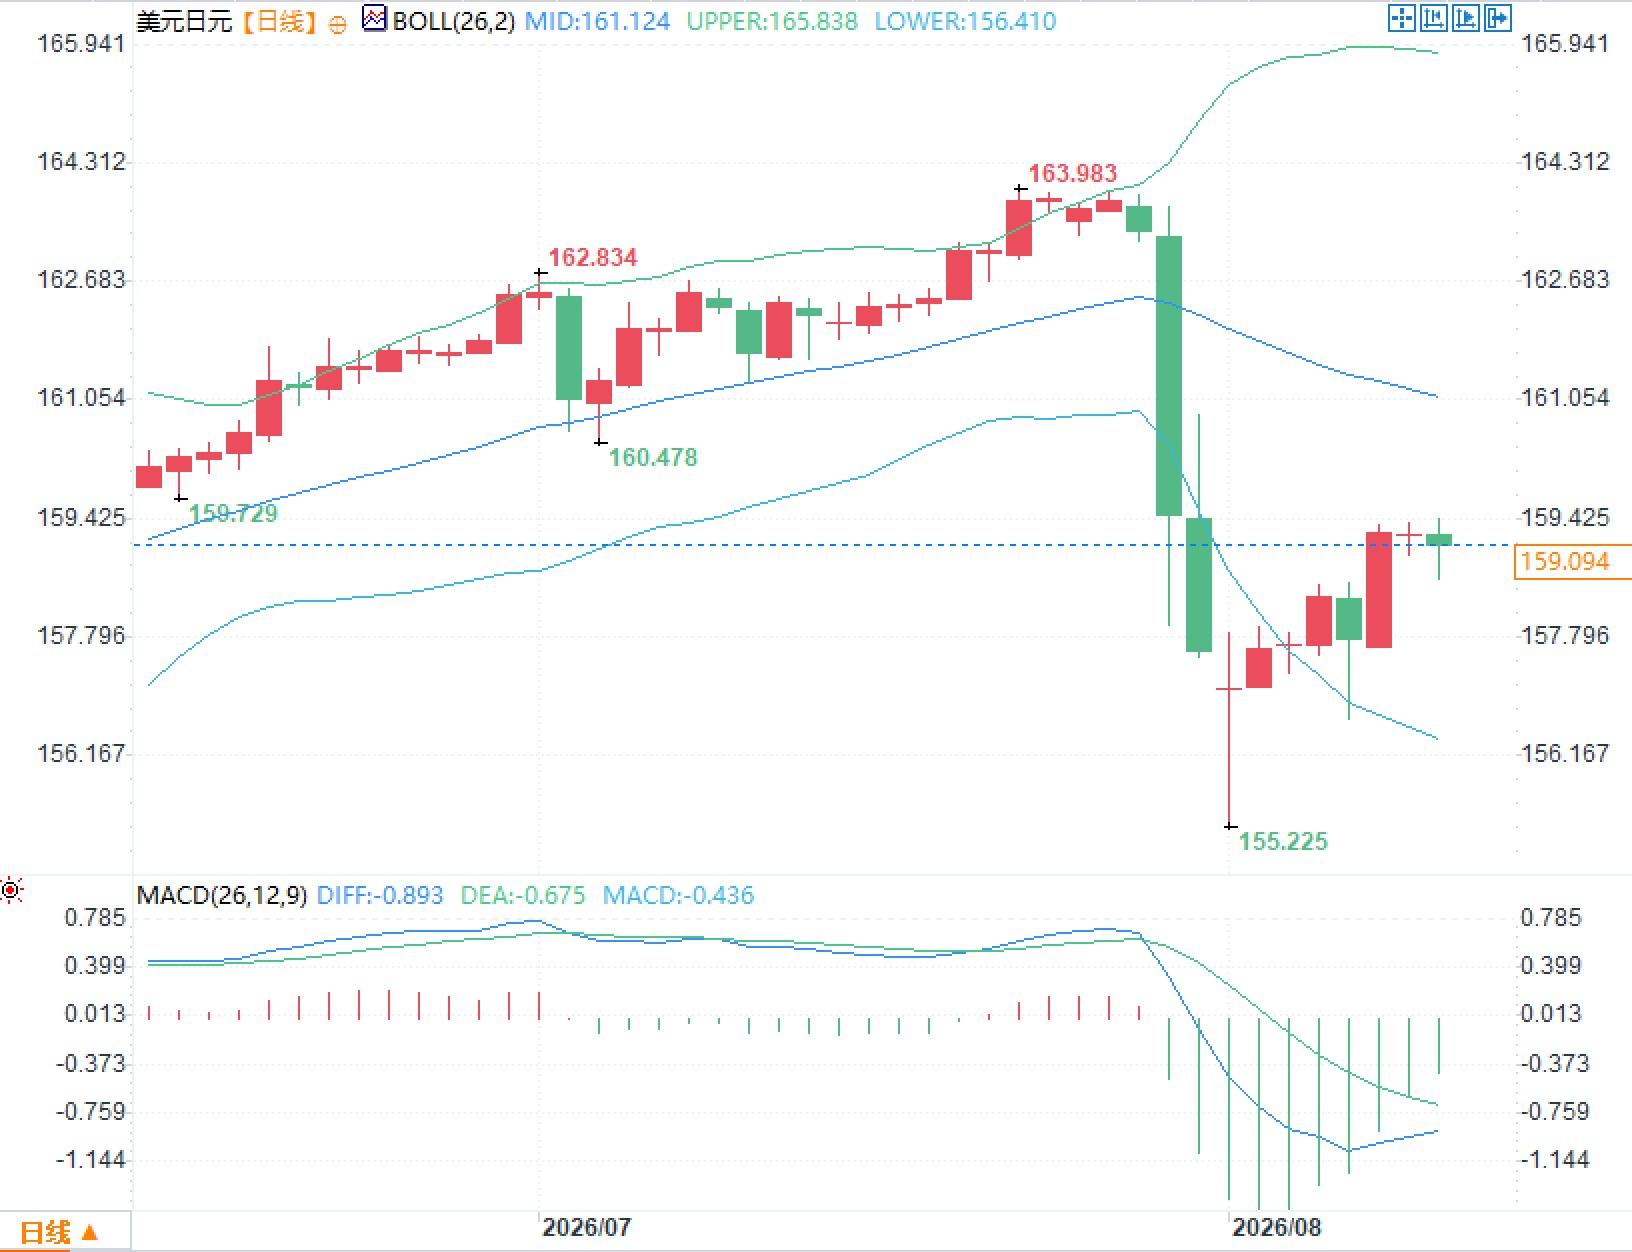 The MACD remains below the zero line, with DIFF and DEA remaining negative, but the histogram has contracted compared to the extreme phase. This mainly indicates that the previous price shocks are still affecting short- and medium-term momentum indicators, while the marginal momentum is different from that at the beginning of the intervention.
Therefore, the market initially lowered its tightening expectations after the jobs report was released, and then reassessed the employment composition and unemployment rate. Currently, the market's pricing in a September Fed policy adjustment is roughly 50/50. This explains why the dollar was able to recover some of the volatility following the jobs report release, rather than forming a sustained one-way trend. It's worth noting that the Fed maintained its federal funds target range at 3.50% to 3.75% at its July meeting. Fed Chairman Warsh emphasized at the time that employment and inflation remain the core of policy decisions, meaning that a single month's jobs data is insufficient to independently determine the September policy choice. Previously, the US June Consumer Price Index (CPI) fell 0.4% month-on-month and rose 3.5% year-on-year; the core CPI, excluding food and energy, was flat month-on-month and rose 2.6% year-on-year. The mainstream market expectation for July's data is a CPI increase of approximately 0.1% month-on-month and 3.4% year-on-year, and a core CPI increase of approximately 0.2% month-on-month and 2.5% year-on-year. For the market, what's more important is how the data changes the interest rate distribution, rather than simply judging whether a particular number is "good" or "bad." If core inflation shows renewed stickiness, the market will need to recalculate how long policy rates will remain high; if core price pressures continue to ease, the pricing of the necessity for tightening will also be re-examined. Therefore, the key focus of this data analysis is the spread of core service prices, housing costs, and commodity inflation. Monthly overall indices are easily affected by energy items, while policymakers are more concerned with whether inflation is spreading from a few items to a wider range of categories. Another key variable in the current USD/JPY structure comes from the Bank of Japan. On July 31, the Bank of Japan voted 8-1 to maintain the target for the unsecured overnight call rate at approximately 1.0%, but a member advocated for an increase to 1.25%, which was not passed. This indicates that there is now clearer discussion within the committee about further normalization. The Bank of Japan's next monetary policy meeting is scheduled for September 17-18. The latest market pricing has significantly increased the probability of a policy adjustment in September, with the market reflecting nearly two-thirds of the probability in some overnight rates. Recent intervention in the foreign exchange market has altered the short-term volatility structure of the USD/JPY pair. However, from a financial perspective, the intervention primarily affects liquidity, positioning, and short-term price disorder, and cannot permanently change the interest rate differential framework between the two currencies. For the Bank of Japan to achieve a more stable macroeconomic foundation for its intervention, the market will ultimately observe changes in the actual policy rate, inflation expectations, and long-term government bond yields. This is the biggest difference between the current USD/JPY pair and the past phase of simple carry trades. The market needs to price in both the intervention risk and the probability of policy normalization, adding the risk of policy jumps to the existing holding costs. Looking at the daily chart, the USD/JPY pair previously formed a high near 163 before quickly falling back, briefly approaching the 155 area, and then returning to around 159. The current price remains below the Bollinger Band's middle band and has moved away from the extreme volatility zone near the lower band. The MACD remains below the zero line, with DIFF and DEA remaining negative, but the histogram has contracted compared to the extreme phase. This mainly indicates that the previous price shocks are still affecting short- and medium-term momentum indicators, while the marginal momentum is different from that at the beginning of the intervention.
- Risk Warning and Disclaimer
- The market involves risk, and trading may not be suitable for all investors. This article is for reference only and does not constitute personal investment advice, nor does it take into account certain users’ specific investment objectives, financial situation, or other needs. Any investment decisions made based on this information are at your own risk.