US Dollar Price Forecast: With the CPI test approaching, the US Dollar Index holds firm at key levels.
2026-08-12 18:18:54
US CPI is the primary catalyst for the foreign exchange market, as it will determine whether inflation trends will alter expectations for the Federal Reserve's (Fed) September interest rate decision. UK Q2 GDP is another important variable influencing GBP/USD and Bank of England (BoE) policy expectations. The US Dollar Index (DXY) remains technically vulnerable below key moving averages, but is holding firm near the support zone of 99.39.  US Dollar Index: CPI Test Puts Fed, Euro, and Pound Under the Spotlight At the start of this week, the US dollar market's attention is entirely focused on the July CPI data to be released later today. This data release will directly determine whether the Federal Reserve pauses its rate hike cycle in September or chooses to continue raising rates. It is predicted that the overall CPI will rise 0.1% month-on-month in July (compared to a 0.4% month-on-month decline in June), with a year-on-year inflation expectation of 3.4%; the core CPI is expected to rise 0.2% month-on-month and 2.5% year-on-year. Judging from recent market performance, most investors expect the Fed to hold rates steady in September, making the marginal impact of today's CPI data particularly crucial. Weak US employment data in July, coupled with the current complex geopolitical situation, has put the Fed in a dilemma. The interim president of the Atlanta Fed pointed out that high inflation and uncertainty surrounding Middle Eastern energy flows are major challenges currently facing the Fed. It is worth noting that at the July policy meeting, three Fed governors have already advocated for a rate hike. For the three major currencies—the US dollar, the euro, and the British pound—the US CPI is the core issue at this stage: a moderate decline in CPI will reduce the likelihood of another Fed rate hike, putting pressure on the dollar; conversely, an unexpectedly high CPI will strengthen the Fed's case for a rate hike this year, potentially providing the dollar with both safe-haven appeal and interest rate differential support. The market is currently pricing in a narrative of "slowing inflation," but any data deviating from expectations could trigger significant volatility. US Dollar Index Technical Analysis: Price Breaks Below Short- and Medium-Term Moving Averages, 99.39 Support Under Test The current US dollar index is at 99.8349, having broken below the 20-day (100.4838) and 50-day (100.5949) moving averages, finding only slight support near the 100-day (99.7519). Looking at the moving average system, the short-term moving averages have turned downwards and formed a death cross with the medium-term moving averages, while the 200-day (99.1672) continues to provide long-term support, resulting in an overall tug-of-war between short-term bearish and long-term bullish sentiment. The MACD indicator has issued a clear bearish signal: the DIFF line is -0.2798, the DEA line is -0.1753, and the MACD histogram is -0.2090. The green momentum bars continue to expand, indicating that downward momentum is still strengthening, and there are no signs of bullish divergence or convergence yet. The RSI indicator is currently reading 40.6362, in the weak zone below the 50 midline, but there is still room before reaching the 30 oversold line, meaning that the bears still have room to exert pressure, and it has not yet reached the extreme oversold rebound trigger point. Key price levels:
 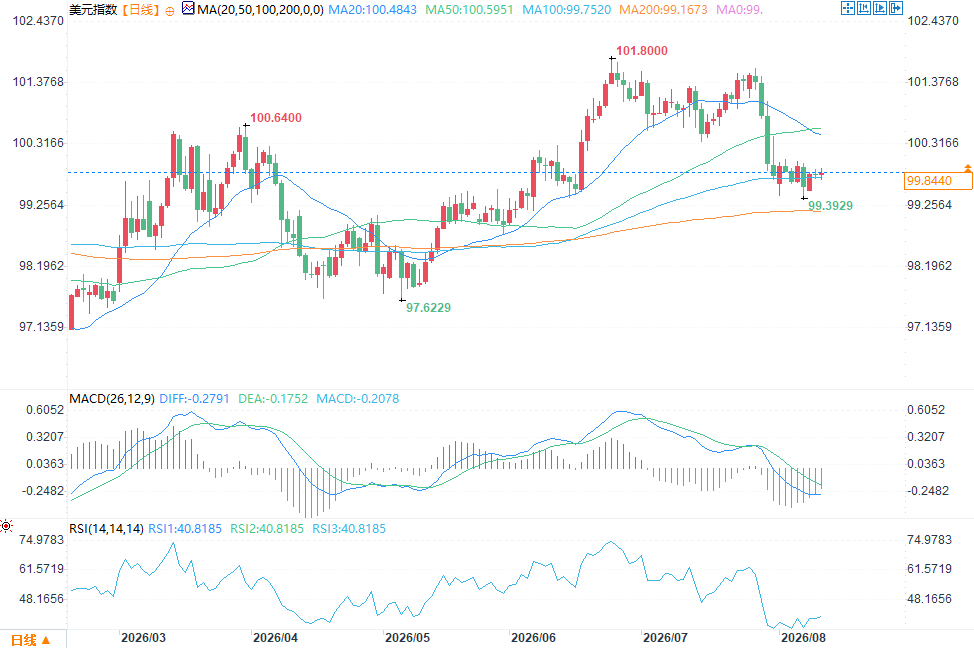 (US Dollar Index Daily Chart Source: FX678) Resistance: First, there's the current price consolidation zone around 99.75-99.83 near the 100-day moving average (MA100). Further upward movement requires breaking through the strong resistance zone at 100.48-100.59, where the 20-day and 50-day moving averages (MA20 and MA50) intersect. Beyond that, the April high of 100.6400 and the historical high of 101.8000 lie below. Support: The immediate support level marked on the chart is 99.3929. A break below this level would target the 200-day moving average (MA200) at 99.1672, with further support pointing to the May low of 97.6229. The US Dollar Index is currently trading below its short- and medium-term moving averages. The MACD histogram is expanding, and the RSI is weak, indicating overall technical pressure. 99.39 is a crucial defense line that bulls must hold. A decisive break below this level would open up downside potential towards the 200-day moving average (99.17) and even deeper. Conversely, if the price can stabilize above 99.39 and recover the 100-day moving average (99.75), a short-term recovery is possible. However, before breaking through the resistance zone of the 100.48-100.59 moving averages, the upside potential is limited, and the overall trend remains bearish. Tonight's CPI data will be the key catalyst determining the success or failure of the 99.39 support level. Institutional View: Dollar Bears Bet on CPI to Bring Breakthrough Opportunity ING analyst Chris Turner points out that last Friday's weak US employment data did not significantly pressure the dollar. The mainstream market view is that inflation trends are the core variable driving the Fed's next move. The market consensus for today's July CPI data is relatively mild: overall CPI up 0.1% month-on-month, core CPI up 0.2% month-on-month, corresponding to year-on-year declines of 3.4% and 2.5% respectively—gradually approaching the Fed's 2% inflation target. Factors driving the data lower include: falling gasoline prices, widening signs of rent deflation, and slowing wage growth. Given that the market has already partially priced in expectations of "moderate inflation," a core CPI increase of only 0.1% month-on-month (which some institutions believe is possible) would have an unexpectedly dovish shock: market pricing in a September rate hike would shift significantly from the current approximately 50% probability to a "hold-the-money" stance; the yield curve is expected to steepen in a bull market, putting pressure on the dollar, especially on pro-cyclical currencies. Furthermore, the US interest rate strategy team warns that long-term yields may also face fiscal pressure—as tariff rebates worsen the US budget deficit, increased long-term bond supply will push up long-term interest rates. Risk Assets & Policy Outlook and Intraday Trading Strategies The aforementioned combination of "moderate CPI + dovish Fed" is generally favorable for the risk environment. Meanwhile, rumors are circulating that President Trump may push for a capital gains tax cut before the midterm elections in early November. From a risk appetite perspective, this policy is a mild negative for the US dollar; however, two converse factors should be noted: first, tax cuts without funding support will further worsen the fiscal deficit, potentially pushing up long-term US Treasury yields and supporting the dollar; second, excessive fiscal expansion may force the Federal Reserve to tighten monetary policy to offset inflationary pressures. ING believes that the moderate CPI data could push the DXY below the lower edge of its 99.40-100.00 trading range. If it breaks below 99.40, the dollar will have room to fall, and EUR/USD and GBP/USD are expected to break through their respective key resistance levels. If the CPI is stronger than expected, the DXY will likely test 100.06 or even 100.36, putting downward pressure on non-US currencies. Investors should closely monitor the market reaction when the CPI is released tonight (Beijing time) and manage the risks of two-way volatility.
US Dollar Index: CPI Test Puts Fed, Euro, and Pound Under the Spotlight At the start of this week, the US dollar market's attention is entirely focused on the July CPI data to be released later today. This data release will directly determine whether the Federal Reserve pauses its rate hike cycle in September or chooses to continue raising rates. It is predicted that the overall CPI will rise 0.1% month-on-month in July (compared to a 0.4% month-on-month decline in June), with a year-on-year inflation expectation of 3.4%; the core CPI is expected to rise 0.2% month-on-month and 2.5% year-on-year. Judging from recent market performance, most investors expect the Fed to hold rates steady in September, making the marginal impact of today's CPI data particularly crucial. Weak US employment data in July, coupled with the current complex geopolitical situation, has put the Fed in a dilemma. The interim president of the Atlanta Fed pointed out that high inflation and uncertainty surrounding Middle Eastern energy flows are major challenges currently facing the Fed. It is worth noting that at the July policy meeting, three Fed governors have already advocated for a rate hike. For the three major currencies—the US dollar, the euro, and the British pound—the US CPI is the core issue at this stage: a moderate decline in CPI will reduce the likelihood of another Fed rate hike, putting pressure on the dollar; conversely, an unexpectedly high CPI will strengthen the Fed's case for a rate hike this year, potentially providing the dollar with both safe-haven appeal and interest rate differential support. The market is currently pricing in a narrative of "slowing inflation," but any data deviating from expectations could trigger significant volatility. US Dollar Index Technical Analysis: Price Breaks Below Short- and Medium-Term Moving Averages, 99.39 Support Under Test The current US dollar index is at 99.8349, having broken below the 20-day (100.4838) and 50-day (100.5949) moving averages, finding only slight support near the 100-day (99.7519). Looking at the moving average system, the short-term moving averages have turned downwards and formed a death cross with the medium-term moving averages, while the 200-day (99.1672) continues to provide long-term support, resulting in an overall tug-of-war between short-term bearish and long-term bullish sentiment. The MACD indicator has issued a clear bearish signal: the DIFF line is -0.2798, the DEA line is -0.1753, and the MACD histogram is -0.2090. The green momentum bars continue to expand, indicating that downward momentum is still strengthening, and there are no signs of bullish divergence or convergence yet. The RSI indicator is currently reading 40.6362, in the weak zone below the 50 midline, but there is still room before reaching the 30 oversold line, meaning that the bears still have room to exert pressure, and it has not yet reached the extreme oversold rebound trigger point. Key price levels: (US Dollar Index Daily Chart Source: FX678) Resistance: First, there's the current price consolidation zone around 99.75-99.83 near the 100-day moving average (MA100). Further upward movement requires breaking through the strong resistance zone at 100.48-100.59, where the 20-day and 50-day moving averages (MA20 and MA50) intersect. Beyond that, the April high of 100.6400 and the historical high of 101.8000 lie below. Support: The immediate support level marked on the chart is 99.3929. A break below this level would target the 200-day moving average (MA200) at 99.1672, with further support pointing to the May low of 97.6229. The US Dollar Index is currently trading below its short- and medium-term moving averages. The MACD histogram is expanding, and the RSI is weak, indicating overall technical pressure. 99.39 is a crucial defense line that bulls must hold. A decisive break below this level would open up downside potential towards the 200-day moving average (99.17) and even deeper. Conversely, if the price can stabilize above 99.39 and recover the 100-day moving average (99.75), a short-term recovery is possible. However, before breaking through the resistance zone of the 100.48-100.59 moving averages, the upside potential is limited, and the overall trend remains bearish. Tonight's CPI data will be the key catalyst determining the success or failure of the 99.39 support level. Institutional View: Dollar Bears Bet on CPI to Bring Breakthrough Opportunity ING analyst Chris Turner points out that last Friday's weak US employment data did not significantly pressure the dollar. The mainstream market view is that inflation trends are the core variable driving the Fed's next move. The market consensus for today's July CPI data is relatively mild: overall CPI up 0.1% month-on-month, core CPI up 0.2% month-on-month, corresponding to year-on-year declines of 3.4% and 2.5% respectively—gradually approaching the Fed's 2% inflation target. Factors driving the data lower include: falling gasoline prices, widening signs of rent deflation, and slowing wage growth. Given that the market has already partially priced in expectations of "moderate inflation," a core CPI increase of only 0.1% month-on-month (which some institutions believe is possible) would have an unexpectedly dovish shock: market pricing in a September rate hike would shift significantly from the current approximately 50% probability to a "hold-the-money" stance; the yield curve is expected to steepen in a bull market, putting pressure on the dollar, especially on pro-cyclical currencies. Furthermore, the US interest rate strategy team warns that long-term yields may also face fiscal pressure—as tariff rebates worsen the US budget deficit, increased long-term bond supply will push up long-term interest rates. Risk Assets & Policy Outlook and Intraday Trading Strategies The aforementioned combination of "moderate CPI + dovish Fed" is generally favorable for the risk environment. Meanwhile, rumors are circulating that President Trump may push for a capital gains tax cut before the midterm elections in early November. From a risk appetite perspective, this policy is a mild negative for the US dollar; however, two converse factors should be noted: first, tax cuts without funding support will further worsen the fiscal deficit, potentially pushing up long-term US Treasury yields and supporting the dollar; second, excessive fiscal expansion may force the Federal Reserve to tighten monetary policy to offset inflationary pressures. ING believes that the moderate CPI data could push the DXY below the lower edge of its 99.40-100.00 trading range. If it breaks below 99.40, the dollar will have room to fall, and EUR/USD and GBP/USD are expected to break through their respective key resistance levels. If the CPI is stronger than expected, the DXY will likely test 100.06 or even 100.36, putting downward pressure on non-US currencies. Investors should closely monitor the market reaction when the CPI is released tonight (Beijing time) and manage the risks of two-way volatility.
- Risk Warning and Disclaimer
- The market involves risk, and trading may not be suitable for all investors. This article is for reference only and does not constitute personal investment advice, nor does it take into account certain users’ specific investment objectives, financial situation, or other needs. Any investment decisions made based on this information are at your own risk.