With inventories falling below 7.9 billion barrels, is the crude oil market losing its most important safety cushion?
2026-08-12 19:56:57
On Wednesday, August 12th, Brent crude futures were trading around $89 per barrel, with limited intraday volatility; WTI crude was around $83.50 per barrel. Recent increases in shipping safety incidents in the Strait of Hormuz and the Bab el-Mandeb Strait, with traffic volume in key shipping lanes significantly lower than pre-conflict levels, have led the market to reassess actual deliverable supply, moving beyond a focus solely on nominal production. Meanwhile, the latest monthly report released on August 12th significantly revised the global oil market deficit for the third quarter of this year upward to 1.8 million barrels per day, more than double the approximately 800,000 barrels per day estimate in the July report. The slower-than-expected recovery in supply, continued inventory depletion, and high oil prices suppressing end-user demand are creating a rare combination: a tight spot market, but with the possibility of a potential easing of the supply-demand balance in the medium term. The most noteworthy aspect of the latest data is not simply the production cuts themselves, but rather the logistical constraints on effective supply. Global oil supply increased by 2.4 million barrels per day to 101.5 million barrels per day in July, but remained 6.3 million barrels per day lower than the same period last year, with 8.3 million barrels per day of production in the Gulf region still constrained. While regional production has recovered from its low levels, exports are hampered by shipping lane safety, tanker scheduling, and infrastructure operational status.  This means that the traditional production analysis framework needs to add a layer of "deliverability discount." If crude oil has been produced but cannot reach refineries along normal routes, with normal insurance costs and normal transportation cycles, then this portion of the resource cannot be fully considered as immediate and effective supply for the spot market. Regional exports recovered significantly in July but subsequently declined again, with exports from relevant regions decreasing by approximately 2.1 million barrels per day to 15 million barrels per day during the month. The uncertainty surrounding the recovery of key shipping routes has created a more complex linkage between refinery procurement, tanker freight rates, insurance costs, and regional crude oil premiums and discounts. Therefore, when traders observe the supply side, the more valuable variables have expanded from "how much was produced" to "how much was loaded, how much passed through, how much arrived at ports, and how long the inventory can sustain operations." The 1.8 million barrels per day shortfall in the third quarter is not the whole problem; more importantly, this shortfall occurred against the backdrop of a significant decrease in the inventory safety cushion. Global observable oil inventories fell by 69 million barrels in July, equivalent to an average decrease of approximately 2.2 million barrels per day. From the end of February to the end of July, cumulative inventories decreased by approximately 410 million barrels, an average decrease of 2.7 million barrels per day. By the end of July, global observable inventories had fallen below 7.9 billion barrels, the first time since April 2025. Declining inventories alter the sensitivity of the crude oil market to unforeseen events. When inventories are ample, short-term transportation disruptions can be absorbed by commercial, maritime, and strategic inventories; however, with sustained inventory declines, the same scale of transportation disruptions typically has a more direct impact on spot premiums/discounts, near-month term structures, and refining margins. This also explains why the recent tensions in the crude oil and refined product markets are not entirely synchronized. Although global refinery crude oil processing volumes increased month-on-month in July, they were still nearly 5 million barrels per day lower than the same period last year. Meanwhile, the diesel, jet fuel, and gasoline supply chains continue to suffer from reduced exports and low inventories, with refining margins remaining high in some regions. For the macro market, the impact of energy prices therefore extends beyond crude oil prices, transmitting to inflation indicators along the lines of diesel, jet fuel, logistics, and industrial costs. The latest report further lowered its 2026 global oil demand forecast, projecting a decrease of 1.6 million barrels per day (bpd) for the year, a further reduction of 510,000 bpd from the previous month's forecast. Demand fell by 4.9 million bpd year-on-year in the second quarter, and is expected to decline by another 2.8 million bpd in the third quarter, primarily due to high fuel prices, supply chain disruptions, and proactive reductions in energy consumption by end-users. Typically, a decline in demand implies an improved supply-demand balance, but the current market is unique in that the decline in supply is occurring at a faster pace, resulting in a situation where "weakening demand and declining inventories coexist." This is key to understanding the current volatility in crude oil prices. The market is not simply pricing based on the strength of economic demand, but rather continuously measuring two speeds: how quickly demand is destroyed and how quickly constrained supply is restored. The latest monthly report even predicts that if transportation recovery and production capacity return proceed as per the baseline scenario, global oil supply could exceed consumption by approximately 4.6 million bpd in 2027. In other words, the current market discussion is not about a static shortage, but rather a mismatch between short-term inventory pressure and potential medium-term surplus.
 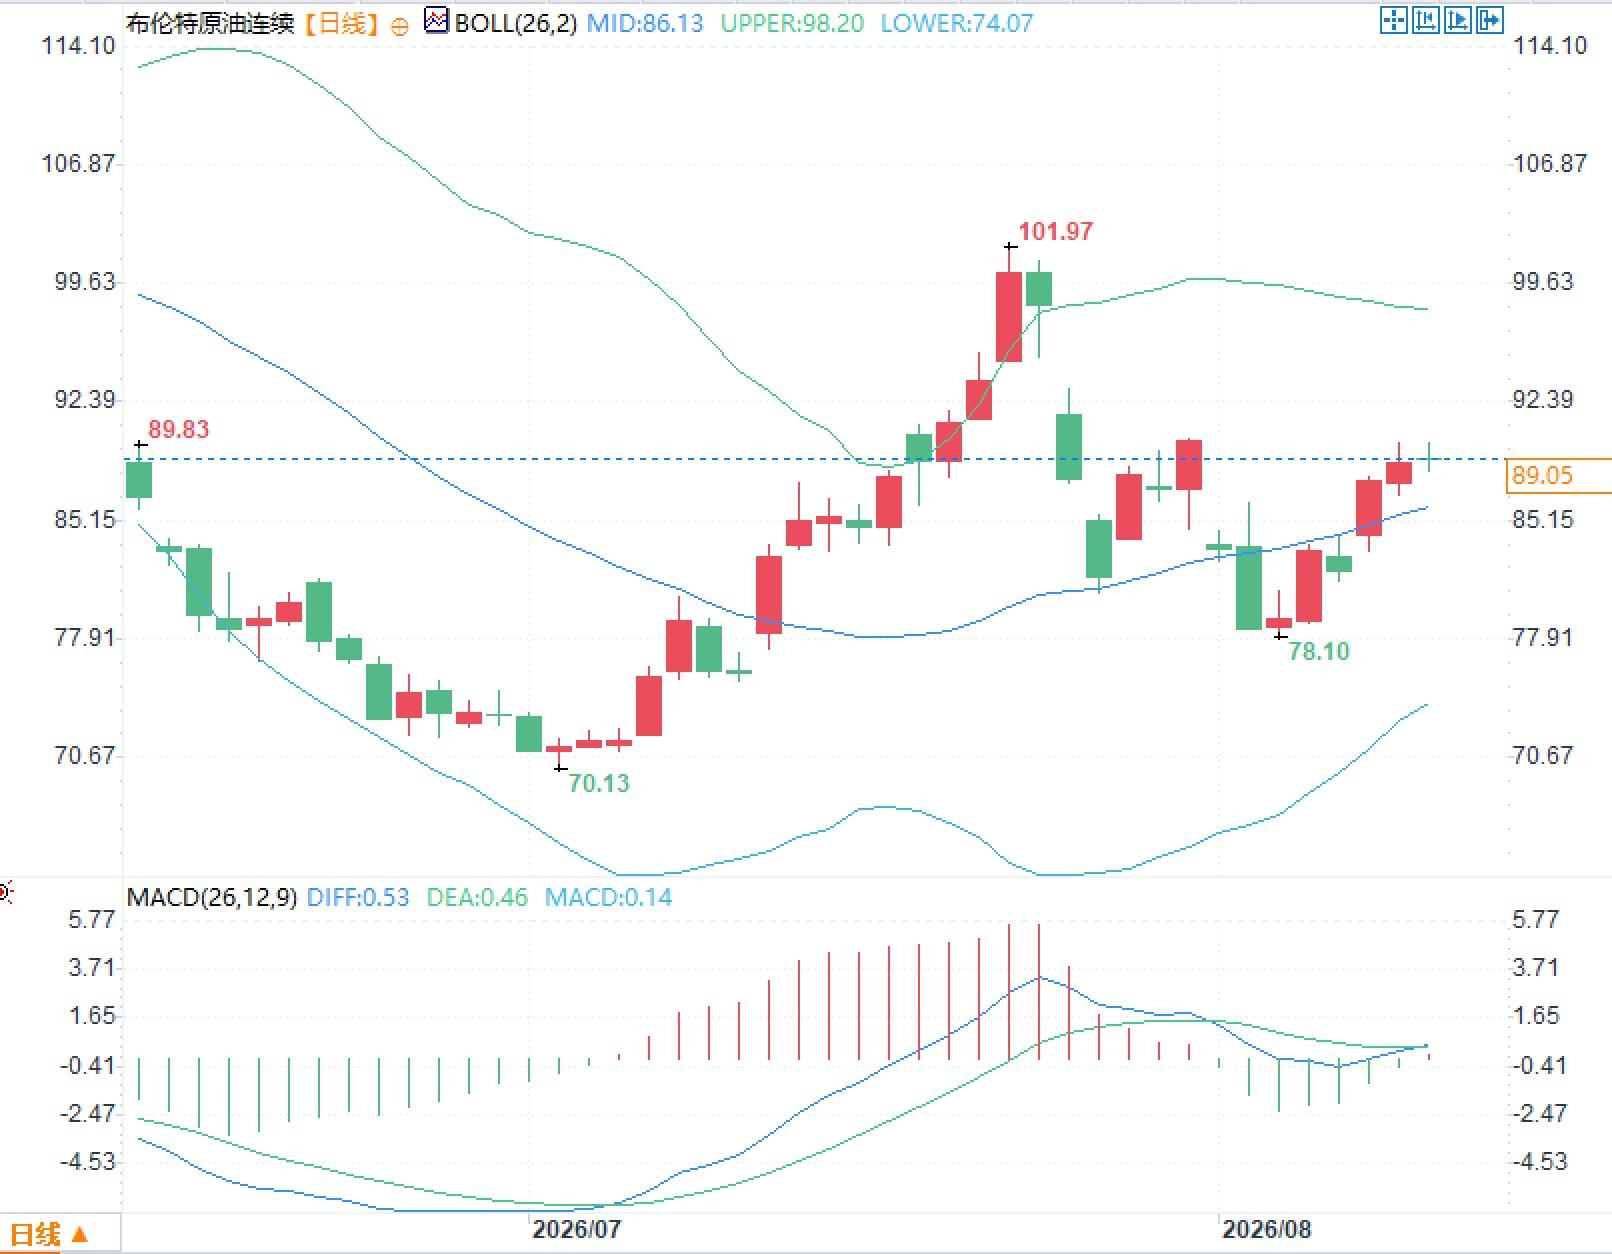 Observing the daily chart of Brent crude oil, the price previously rebounded rapidly from a low point, briefly touching around $100, before experiencing a significant pullback and recovering again from the $78 area. Currently, the price is back above the Bollinger Band's middle band, which is starting to rise, while the upper band is flattening and the lower band is noticeably moving upwards, indicating that the recent price distribution center has shifted since early July.
This means that the traditional production analysis framework needs to add a layer of "deliverability discount." If crude oil has been produced but cannot reach refineries along normal routes, with normal insurance costs and normal transportation cycles, then this portion of the resource cannot be fully considered as immediate and effective supply for the spot market. Regional exports recovered significantly in July but subsequently declined again, with exports from relevant regions decreasing by approximately 2.1 million barrels per day to 15 million barrels per day during the month. The uncertainty surrounding the recovery of key shipping routes has created a more complex linkage between refinery procurement, tanker freight rates, insurance costs, and regional crude oil premiums and discounts. Therefore, when traders observe the supply side, the more valuable variables have expanded from "how much was produced" to "how much was loaded, how much passed through, how much arrived at ports, and how long the inventory can sustain operations." The 1.8 million barrels per day shortfall in the third quarter is not the whole problem; more importantly, this shortfall occurred against the backdrop of a significant decrease in the inventory safety cushion. Global observable oil inventories fell by 69 million barrels in July, equivalent to an average decrease of approximately 2.2 million barrels per day. From the end of February to the end of July, cumulative inventories decreased by approximately 410 million barrels, an average decrease of 2.7 million barrels per day. By the end of July, global observable inventories had fallen below 7.9 billion barrels, the first time since April 2025. Declining inventories alter the sensitivity of the crude oil market to unforeseen events. When inventories are ample, short-term transportation disruptions can be absorbed by commercial, maritime, and strategic inventories; however, with sustained inventory declines, the same scale of transportation disruptions typically has a more direct impact on spot premiums/discounts, near-month term structures, and refining margins. This also explains why the recent tensions in the crude oil and refined product markets are not entirely synchronized. Although global refinery crude oil processing volumes increased month-on-month in July, they were still nearly 5 million barrels per day lower than the same period last year. Meanwhile, the diesel, jet fuel, and gasoline supply chains continue to suffer from reduced exports and low inventories, with refining margins remaining high in some regions. For the macro market, the impact of energy prices therefore extends beyond crude oil prices, transmitting to inflation indicators along the lines of diesel, jet fuel, logistics, and industrial costs. The latest report further lowered its 2026 global oil demand forecast, projecting a decrease of 1.6 million barrels per day (bpd) for the year, a further reduction of 510,000 bpd from the previous month's forecast. Demand fell by 4.9 million bpd year-on-year in the second quarter, and is expected to decline by another 2.8 million bpd in the third quarter, primarily due to high fuel prices, supply chain disruptions, and proactive reductions in energy consumption by end-users. Typically, a decline in demand implies an improved supply-demand balance, but the current market is unique in that the decline in supply is occurring at a faster pace, resulting in a situation where "weakening demand and declining inventories coexist." This is key to understanding the current volatility in crude oil prices. The market is not simply pricing based on the strength of economic demand, but rather continuously measuring two speeds: how quickly demand is destroyed and how quickly constrained supply is restored. The latest monthly report even predicts that if transportation recovery and production capacity return proceed as per the baseline scenario, global oil supply could exceed consumption by approximately 4.6 million bpd in 2027. In other words, the current market discussion is not about a static shortage, but rather a mismatch between short-term inventory pressure and potential medium-term surplus. Observing the daily chart of Brent crude oil, the price previously rebounded rapidly from a low point, briefly touching around $100, before experiencing a significant pullback and recovering again from the $78 area. Currently, the price is back above the Bollinger Band's middle band, which is starting to rise, while the upper band is flattening and the lower band is noticeably moving upwards, indicating that the recent price distribution center has shifted since early July.
- Risk Warning and Disclaimer
- The market involves risk, and trading may not be suitable for all investors. This article is for reference only and does not constitute personal investment advice, nor does it take into account certain users’ specific investment objectives, financial situation, or other needs. Any investment decisions made based on this information are at your own risk.