The CPI will determine whether gold prices can break through $4435.25 or turn downwards.
2026-08-12 19:50:54
On Wednesday (August 12), gold prices approached recent highs again as bulls were not yet ready to abandon the "interest rate easing trade" that began after the weaker-than-expected nonfarm payroll data in July.  Gold prices touched a 10-week high on Tuesday but failed to hold onto gains, ultimately closing lower. However, this pullback did not trigger sustained selling – buying quickly returned. This price action itself is a clear signal: as long as the market still believes the Federal Reserve will struggle to find sufficient justification for a rate hike at its September meeting, buying support for gold remains real. Wednesday morning's Consumer Price Index (CPI) report will be the ultimate test of whether this market belief can continue. This rebound has brought gold prices back to near Tuesday's high of $4435.25, trading just below a key retracement level – a level that has acted as a dividing line between bullish and bearish sentiment this week. Crude oil approaches $90, gold bulls face a complex situation. Brent crude oil prices are climbing towards the $90 mark. Continued restrictions on shipping in the Strait of Hormuz, coupled with Houthi attacks threatening alternative routes, are putting downward pressure on gold bulls, as every additional trading day crude oil remains at high levels makes the argument for a September rate hike harder to ignore. Looking back at Tuesday's market: gold surged in the morning but turned to selling in the afternoon; while crude oil held onto its gains in both trading sessions. The core logic behind current gold trading is not the geopolitical conflict itself, but rather the cost of that conflict reaching gas stations—a cost that continues to rise. Weaker-than-expected non-farm payrolls supported gold prices, but the CPI will determine whether the rebound can continue . After the July non-farm payrolls report showed weaker-than-expected hiring, gold recorded its largest weekly gain since January. As a result, market expectations for a September rate hike plummeted from about 60% to nearly 50%, and gold prices broke upwards accordingly. For a market that has experienced several weeks of correction, this is enough to attract bulls back in. However, the problem is that a 50% probability means that the differences of opinion are far from over. At the last meeting, three policymakers voted to raise rates. Chicago Fed President Austan Goolsby clearly stated this week that some Fed officials are still focusing on inflation, rather than just the weakness in the labor market. A weak jobs report did not erase the hawkish forces within the committee; it merely allowed the doves to gain a louder voice in the market for a few trading days. US Treasury yields await data . On Wednesday, US Treasury yields fell: the 10-year yield was close to 4.66%, the 2-year yield was around 4.20%, and the 30-year yield remained near 5.22%. This calm in the bond market is essentially waiting for the same figure as gold—the CPI. Economists expect the overall CPI to rise 0.1% month-on-month and 3.4% year-on-year in July; the core CPI is expected to rise 0.2% month-on-month and 2.5% year-on-year. All the gains since last week have hinged on this data. Gold prices broke upwards because the jobs data weakened the Fed's confidence in raising interest rates; the CPI will either further weaken that confidence or make it hawkish again. The speed of asset repricing before and after the September meeting will be proportional to the extent to which the actual data deviates from expectations. Furthermore, the Producer Price Index (PPI) will follow on Thursday, and the inflation narrative will not end with a single report. Spot Gold Technical Analysis
 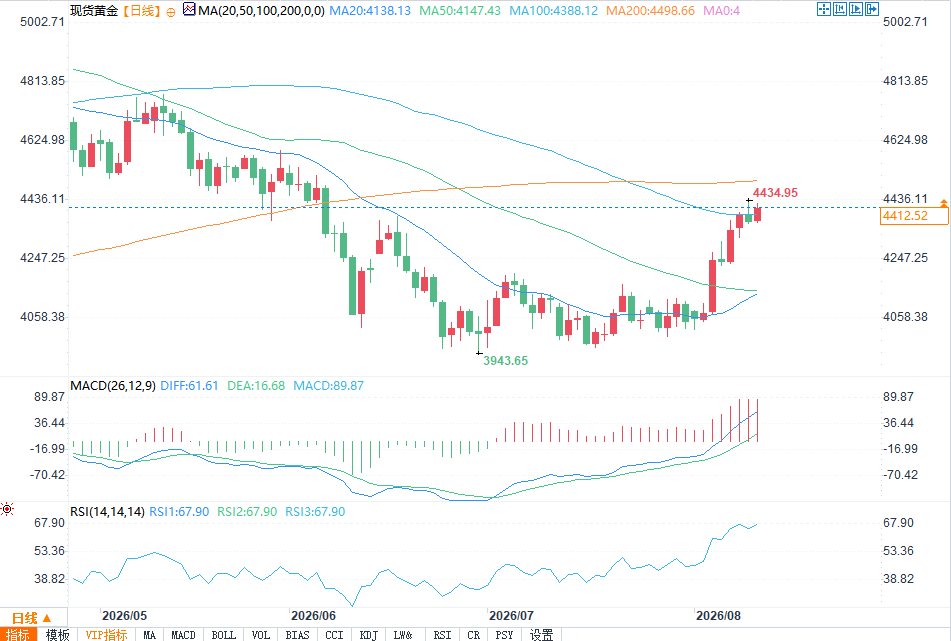 (Spot Gold Daily Chart Source: FX678) Spot gold rose in early trading on Wednesday, but prices remained within yesterday's trading range. This price pattern suggests the market is in a wait-and-see mode, with volatility poised to erupt – a typical characteristic before a major catalyst (such as today's CPI report). The market is currently testing the 50% retracement level at $4416.82, slightly below the closing reversal top of $4435.25 formed this week. Upside Path If gold prices can continue to trade above $4416.82, it will indicate the presence of buying power. A break above $4435.25 would negate the closing reversal top pattern, potentially resuming the uptrend. This could trigger a move towards $4481.78 and the 200-day moving average at $4499.29, with a subsequent target of the long-term Fibonacci level at $4541.88. The $4481.78 level, a 20% drop from its historical high, is seen by some traders as a marker of the start of a bear market; the 200-day moving average is also a significant technical target. The price action, from breaking the 50-day moving average ($4148.11) to almost testing the 200-day moving average, took only five trading days, demonstrating considerable strength and reflecting decisive buying power. Downside Risks Conversely, a break below yesterday's low of $4356.70 could trigger an accelerated decline. It's important to note that below $4356.70, there is no clear support zone until the $4188.67 to $4130.48 range – meaning a break below this level could quickly open up downside potential. Key Points to Watch Gold rose on Wednesday as the impact of the weaker-than-expected non-farm payrolls data continued to unfold, and bulls quickly returned after Tuesday's sell-off, rather than allowing a reversal pattern to develop. However, as the CPI was released, crude oil was nearing $90, reshaping the inflation logic—a narrative window the jobs report attempted to close. The three hawkish officials who voted for a rate hike at the last meeting haven't disappeared; Wednesday's data will determine whether the rest of the committee aligns with them or drifts further away. The retracement level of $4416.82 and Tuesday's reversal high of $4435.25 are two key price levels defining direction: A break above both invalidates the reversal pattern, restarts the uptrend, and targets the 200-day moving average; Failure to hold the rebound and a break below $4,356.70 creates a huge vacuum below, with support well below $4200.
Gold prices touched a 10-week high on Tuesday but failed to hold onto gains, ultimately closing lower. However, this pullback did not trigger sustained selling – buying quickly returned. This price action itself is a clear signal: as long as the market still believes the Federal Reserve will struggle to find sufficient justification for a rate hike at its September meeting, buying support for gold remains real. Wednesday morning's Consumer Price Index (CPI) report will be the ultimate test of whether this market belief can continue. This rebound has brought gold prices back to near Tuesday's high of $4435.25, trading just below a key retracement level – a level that has acted as a dividing line between bullish and bearish sentiment this week. Crude oil approaches $90, gold bulls face a complex situation. Brent crude oil prices are climbing towards the $90 mark. Continued restrictions on shipping in the Strait of Hormuz, coupled with Houthi attacks threatening alternative routes, are putting downward pressure on gold bulls, as every additional trading day crude oil remains at high levels makes the argument for a September rate hike harder to ignore. Looking back at Tuesday's market: gold surged in the morning but turned to selling in the afternoon; while crude oil held onto its gains in both trading sessions. The core logic behind current gold trading is not the geopolitical conflict itself, but rather the cost of that conflict reaching gas stations—a cost that continues to rise. Weaker-than-expected non-farm payrolls supported gold prices, but the CPI will determine whether the rebound can continue . After the July non-farm payrolls report showed weaker-than-expected hiring, gold recorded its largest weekly gain since January. As a result, market expectations for a September rate hike plummeted from about 60% to nearly 50%, and gold prices broke upwards accordingly. For a market that has experienced several weeks of correction, this is enough to attract bulls back in. However, the problem is that a 50% probability means that the differences of opinion are far from over. At the last meeting, three policymakers voted to raise rates. Chicago Fed President Austan Goolsby clearly stated this week that some Fed officials are still focusing on inflation, rather than just the weakness in the labor market. A weak jobs report did not erase the hawkish forces within the committee; it merely allowed the doves to gain a louder voice in the market for a few trading days. US Treasury yields await data . On Wednesday, US Treasury yields fell: the 10-year yield was close to 4.66%, the 2-year yield was around 4.20%, and the 30-year yield remained near 5.22%. This calm in the bond market is essentially waiting for the same figure as gold—the CPI. Economists expect the overall CPI to rise 0.1% month-on-month and 3.4% year-on-year in July; the core CPI is expected to rise 0.2% month-on-month and 2.5% year-on-year. All the gains since last week have hinged on this data. Gold prices broke upwards because the jobs data weakened the Fed's confidence in raising interest rates; the CPI will either further weaken that confidence or make it hawkish again. The speed of asset repricing before and after the September meeting will be proportional to the extent to which the actual data deviates from expectations. Furthermore, the Producer Price Index (PPI) will follow on Thursday, and the inflation narrative will not end with a single report. Spot Gold Technical Analysis (Spot Gold Daily Chart Source: FX678) Spot gold rose in early trading on Wednesday, but prices remained within yesterday's trading range. This price pattern suggests the market is in a wait-and-see mode, with volatility poised to erupt – a typical characteristic before a major catalyst (such as today's CPI report). The market is currently testing the 50% retracement level at $4416.82, slightly below the closing reversal top of $4435.25 formed this week. Upside Path If gold prices can continue to trade above $4416.82, it will indicate the presence of buying power. A break above $4435.25 would negate the closing reversal top pattern, potentially resuming the uptrend. This could trigger a move towards $4481.78 and the 200-day moving average at $4499.29, with a subsequent target of the long-term Fibonacci level at $4541.88. The $4481.78 level, a 20% drop from its historical high, is seen by some traders as a marker of the start of a bear market; the 200-day moving average is also a significant technical target. The price action, from breaking the 50-day moving average ($4148.11) to almost testing the 200-day moving average, took only five trading days, demonstrating considerable strength and reflecting decisive buying power. Downside Risks Conversely, a break below yesterday's low of $4356.70 could trigger an accelerated decline. It's important to note that below $4356.70, there is no clear support zone until the $4188.67 to $4130.48 range – meaning a break below this level could quickly open up downside potential. Key Points to Watch Gold rose on Wednesday as the impact of the weaker-than-expected non-farm payrolls data continued to unfold, and bulls quickly returned after Tuesday's sell-off, rather than allowing a reversal pattern to develop. However, as the CPI was released, crude oil was nearing $90, reshaping the inflation logic—a narrative window the jobs report attempted to close. The three hawkish officials who voted for a rate hike at the last meeting haven't disappeared; Wednesday's data will determine whether the rest of the committee aligns with them or drifts further away. The retracement level of $4416.82 and Tuesday's reversal high of $4435.25 are two key price levels defining direction: A break above both invalidates the reversal pattern, restarts the uptrend, and targets the 200-day moving average; Failure to hold the rebound and a break below $4,356.70 creates a huge vacuum below, with support well below $4200.
- Risk Warning and Disclaimer
- The market involves risk, and trading may not be suitable for all investors. This article is for reference only and does not constitute personal investment advice, nor does it take into account certain users’ specific investment objectives, financial situation, or other needs. Any investment decisions made based on this information are at your own risk.