Gold prices rallied before retreating and returning to range-bound trading.
2026-08-14 14:32:57
Spot gold continued its pullback from the previous trading day during Asian trading hours on Friday, with prices remaining under pressure after hitting a two-month high of around $4,450, but finding some support near $4,300. Gold had previously experienced a rapid rise, with a cumulative increase of over 8% since August, so the current decline is influenced not only by the dollar and interest rate factors but also by significant profit-taking pressure. On August 13, spot gold briefly touched around $4,449 before falling back to around $4,350, and the market began to reassess the balance of power between bulls and bears around the $4,500 psychological level.  The latest US inflation data provided fundamental support for gold. Data released by the US Bureau of Labor Statistics showed that the final demand PPI was flat month-on-month in July, significantly lower than the market's previous expectation of a 0.2% increase; the year-on-year growth rate fell to 4.7% from 5.5% in June. Specifically, final demand goods prices fell by 0.7%, final demand services prices rose by 0.2%, energy prices fell by 3.1%, and gasoline prices fell by 5.7%, indicating that the decline in energy costs significantly suppressed overall production-side prices. Meanwhile, the US July CPI also showed some easing of inflationary pressures. The overall CPI rose 3.4% year-on-year in July, lower than 3.5% in June; the core CPI rose 2.5% year-on-year, lower than the previous month's 2.6%. Month-on-month, the core CPI rose 0.2%, indicating that potential price pressures still exist, but there are no signs of a renewed acceleration. The combined effect of these two inflation indicators further reduced market expectations for a rapid tightening of policy by the Federal Reserve in the short term. Related interest rate market pricing shows that investors' expectations for a September rate hike have significantly decreased. Weakening interest rate expectations typically imply downward pressure on US Treasury yields, which lowers the opportunity cost of holding non-interest-bearing gold, thus supporting gold prices. However, gold did not immediately launch a new round of one-sided gains despite cooling inflation because the market had already priced in some of the positive news. Gold rose rapidly from around $4,000 to around $4,450 in a short period, and after the significant increase, some investors chose to lock in profits. Latest market data shows that gold futures closed down about 1.03% at $4,363.60 on August 13, ending a four-day winning streak; spot gold also fell significantly. This means that the core issue in the current gold market has shifted from "whether the Fed will continue to tighten" to "whether declining interest rate expectations can translate into actual capital inflows." If US Treasury yields continue to decline and the dollar index weakens further, gold still has a chance to retest the $4,450-$4,500 area; however, if US economic data remains strong and yields rise again, gold may continue to undergo technical corrections. US July retail sales have become a new important short-term variable. The market is awaiting US consumer data to determine whether the high-interest-rate environment has begun to significantly impact household spending. Weaker-than-expected retail sales will reinforce the assessment of slowing economic growth and the Federal Reserve delaying interest rate hikes, which would be bullish for gold. Conversely, significantly stronger-than-expected retail sales could drive a rebound in the US dollar and US Treasury yields, putting greater pressure on gold in the short term. Furthermore, global risk factors remain a crucial underlying support for gold. Uncertainties regarding energy supply and key shipping routes persist, and market risk premiums have not completely disappeared. In this environment, gold still possesses safe-haven and asset allocation value. However, it's worth noting that when market risks escalate rapidly, the US dollar also attracts safe-haven funds, so gold and the dollar may rise in tandem for a period, rather than simply moving in opposite directions. From a funding and sentiment perspective, gold is currently clearly in a phase of struggle between high-level profit-taking and medium- to long-term buying. The rapid rise in the previous period attracted trend-following funds, while the $4450-$4500 area is prone to triggering profit-taking. As long as prices don't break below key technical support, the recent pullback can still be understood as a normal correction within an uptrend. However, if $4285 is effectively broken, it means the correction may be more significant, and the market needs to reassess the sustainability of the rally since $4000. Gold's medium- to long-term fundamentals still offer some support. There is room for a readjustment of the global interest rate path, while factors such as the dollar's creditworthiness, fiscal conditions, geopolitical risks, and central bank gold demand will continue to influence gold's long-term investment value. Therefore, the current pullback does not mean the end of gold's long-term upward trend; it is more likely a valuation digestion after a rapid rise. It is worth noting that gold's recent volatility has increased significantly. On August 13th, after hitting a two-month high, gold prices experienced a more than 1% intraday correction, indicating that the area around $4500 has entered a zone of intense battle between bulls and bears. Therefore, in the short term, it is not advisable to chase the rally solely based on the cooling of US inflation; instead, it is crucial to observe whether the dollar, US Treasury yields, and the $4285 support level change simultaneously. From a daily chart perspective, gold rose rapidly after breaking through the psychological level of $4000, reaching approximately $4450 this week, before experiencing significant profit-taking. Currently, the price remains above $4300, and the overall medium-term uptrend structure remains intact. The first resistance level to watch is around $4347, followed by the previous high area of $4448-$4450. A decisive break above $4450 would target the psychological level of $4500; a further break above $4500 could open up further upside potential. On the downside, the first support level to watch is the 38.2% Fibonacci retracement around $4285, followed by the 50% retracement around $4234 and the 61.8% retracement around $4184. A break below $4285 could significantly deepen the short-term correction in gold; a break below $4234 would put the uptrend structure since $4000 under greater scrutiny. In terms of momentum, the overbought pressure following the rapid rise on the daily chart is dissipating, and short-term bullish momentum has cooled somewhat, but no signals have yet emerged to confirm a medium-term trend reversal. From a 4-hour chart perspective, gold is currently still trading above the 200-period EMA, indicating that the medium-term bullish structure remains intact for the time being. However, the MACD has fallen below the zero line and is trading below the signal line, showing a significant weakening of short-term upward momentum; the RSI is around 42, below the 50 midline, indicating that bearish momentum is gaining a temporary advantage, but has not yet entered severely oversold territory. The first resistance level to watch is $4347. If this level is broken and held, there is a chance to challenge $4400 and $4450 again; if it falls below $4285, the correction could extend further to $4234 and $4184. In summary, the 4-hour chart currently represents a "technical correction within an uptrend," with $4285 being a key level for judging the short-term strength of gold, and $4450 being a crucial breakout level for reconfirming the bullish trend.
 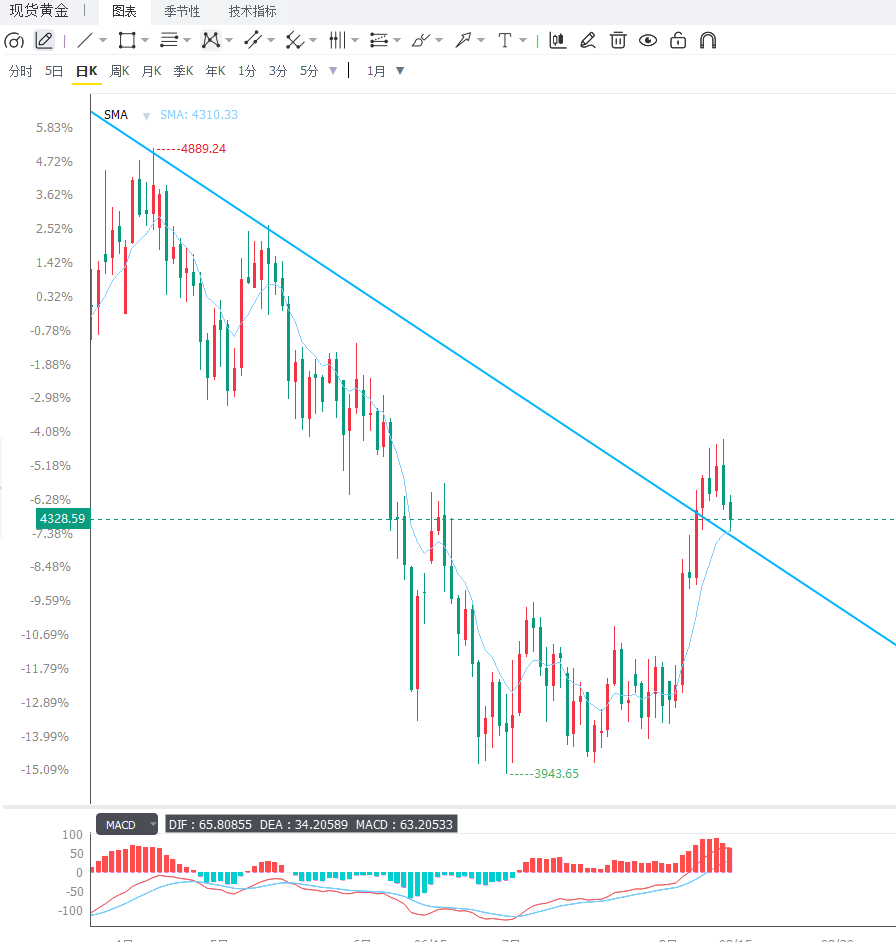 Editor's Summary: The recent upward trend in gold prices has not been undermined by US inflation data; in fact, it has been strengthened. The US July PPI remained flat month-on-month and fell to 4.7% year-on-year, while the core CPI fell to 2.5% year-on-year, reducing pressure on the Federal Reserve to raise interest rates in the short term and creating a more favorable interest rate environment for gold, a non-interest-bearing asset. However, gold had already priced in a significant amount of this positive news, and after a rapid rise from around $4,000 to around $4,450, profit-taking is a normal phenomenon. Whether the current $4,300-$4,285 range can hold will determine whether this pullback is a healthy consolidation or a weakening trend. If $4,285 holds as effective support, and US retail sales fall short of expectations, US Treasury yields continue to decline, and the dollar weakens further, then gold is expected to retest $4,450 and potentially test $4,500. Conversely, if US economic data continues to be stronger than expected, and the dollar and US Treasury yields rebound simultaneously, a break below $4,285 could lead to further corrections towards $4,234 or even $4,184. Overall, the medium-term uptrend for gold remains positive, but in the short term, it has transitioned from a one-sided upward move to a high-level consolidation phase. Going forward, investors should focus on Federal Reserve policy expectations, US retail sales, US Treasury yields, the US dollar index, and changes in global risk premiums. Currently, the most important thing in the market is not chasing short-term fluctuations, but rather observing the breakout direction between the $4285 support level and the $4450 resistance level.
The latest US inflation data provided fundamental support for gold. Data released by the US Bureau of Labor Statistics showed that the final demand PPI was flat month-on-month in July, significantly lower than the market's previous expectation of a 0.2% increase; the year-on-year growth rate fell to 4.7% from 5.5% in June. Specifically, final demand goods prices fell by 0.7%, final demand services prices rose by 0.2%, energy prices fell by 3.1%, and gasoline prices fell by 5.7%, indicating that the decline in energy costs significantly suppressed overall production-side prices. Meanwhile, the US July CPI also showed some easing of inflationary pressures. The overall CPI rose 3.4% year-on-year in July, lower than 3.5% in June; the core CPI rose 2.5% year-on-year, lower than the previous month's 2.6%. Month-on-month, the core CPI rose 0.2%, indicating that potential price pressures still exist, but there are no signs of a renewed acceleration. The combined effect of these two inflation indicators further reduced market expectations for a rapid tightening of policy by the Federal Reserve in the short term. Related interest rate market pricing shows that investors' expectations for a September rate hike have significantly decreased. Weakening interest rate expectations typically imply downward pressure on US Treasury yields, which lowers the opportunity cost of holding non-interest-bearing gold, thus supporting gold prices. However, gold did not immediately launch a new round of one-sided gains despite cooling inflation because the market had already priced in some of the positive news. Gold rose rapidly from around $4,000 to around $4,450 in a short period, and after the significant increase, some investors chose to lock in profits. Latest market data shows that gold futures closed down about 1.03% at $4,363.60 on August 13, ending a four-day winning streak; spot gold also fell significantly. This means that the core issue in the current gold market has shifted from "whether the Fed will continue to tighten" to "whether declining interest rate expectations can translate into actual capital inflows." If US Treasury yields continue to decline and the dollar index weakens further, gold still has a chance to retest the $4,450-$4,500 area; however, if US economic data remains strong and yields rise again, gold may continue to undergo technical corrections. US July retail sales have become a new important short-term variable. The market is awaiting US consumer data to determine whether the high-interest-rate environment has begun to significantly impact household spending. Weaker-than-expected retail sales will reinforce the assessment of slowing economic growth and the Federal Reserve delaying interest rate hikes, which would be bullish for gold. Conversely, significantly stronger-than-expected retail sales could drive a rebound in the US dollar and US Treasury yields, putting greater pressure on gold in the short term. Furthermore, global risk factors remain a crucial underlying support for gold. Uncertainties regarding energy supply and key shipping routes persist, and market risk premiums have not completely disappeared. In this environment, gold still possesses safe-haven and asset allocation value. However, it's worth noting that when market risks escalate rapidly, the US dollar also attracts safe-haven funds, so gold and the dollar may rise in tandem for a period, rather than simply moving in opposite directions. From a funding and sentiment perspective, gold is currently clearly in a phase of struggle between high-level profit-taking and medium- to long-term buying. The rapid rise in the previous period attracted trend-following funds, while the $4450-$4500 area is prone to triggering profit-taking. As long as prices don't break below key technical support, the recent pullback can still be understood as a normal correction within an uptrend. However, if $4285 is effectively broken, it means the correction may be more significant, and the market needs to reassess the sustainability of the rally since $4000. Gold's medium- to long-term fundamentals still offer some support. There is room for a readjustment of the global interest rate path, while factors such as the dollar's creditworthiness, fiscal conditions, geopolitical risks, and central bank gold demand will continue to influence gold's long-term investment value. Therefore, the current pullback does not mean the end of gold's long-term upward trend; it is more likely a valuation digestion after a rapid rise. It is worth noting that gold's recent volatility has increased significantly. On August 13th, after hitting a two-month high, gold prices experienced a more than 1% intraday correction, indicating that the area around $4500 has entered a zone of intense battle between bulls and bears. Therefore, in the short term, it is not advisable to chase the rally solely based on the cooling of US inflation; instead, it is crucial to observe whether the dollar, US Treasury yields, and the $4285 support level change simultaneously. From a daily chart perspective, gold rose rapidly after breaking through the psychological level of $4000, reaching approximately $4450 this week, before experiencing significant profit-taking. Currently, the price remains above $4300, and the overall medium-term uptrend structure remains intact. The first resistance level to watch is around $4347, followed by the previous high area of $4448-$4450. A decisive break above $4450 would target the psychological level of $4500; a further break above $4500 could open up further upside potential. On the downside, the first support level to watch is the 38.2% Fibonacci retracement around $4285, followed by the 50% retracement around $4234 and the 61.8% retracement around $4184. A break below $4285 could significantly deepen the short-term correction in gold; a break below $4234 would put the uptrend structure since $4000 under greater scrutiny. In terms of momentum, the overbought pressure following the rapid rise on the daily chart is dissipating, and short-term bullish momentum has cooled somewhat, but no signals have yet emerged to confirm a medium-term trend reversal. From a 4-hour chart perspective, gold is currently still trading above the 200-period EMA, indicating that the medium-term bullish structure remains intact for the time being. However, the MACD has fallen below the zero line and is trading below the signal line, showing a significant weakening of short-term upward momentum; the RSI is around 42, below the 50 midline, indicating that bearish momentum is gaining a temporary advantage, but has not yet entered severely oversold territory. The first resistance level to watch is $4347. If this level is broken and held, there is a chance to challenge $4400 and $4450 again; if it falls below $4285, the correction could extend further to $4234 and $4184. In summary, the 4-hour chart currently represents a "technical correction within an uptrend," with $4285 being a key level for judging the short-term strength of gold, and $4450 being a crucial breakout level for reconfirming the bullish trend. Editor's Summary: The recent upward trend in gold prices has not been undermined by US inflation data; in fact, it has been strengthened. The US July PPI remained flat month-on-month and fell to 4.7% year-on-year, while the core CPI fell to 2.5% year-on-year, reducing pressure on the Federal Reserve to raise interest rates in the short term and creating a more favorable interest rate environment for gold, a non-interest-bearing asset. However, gold had already priced in a significant amount of this positive news, and after a rapid rise from around $4,000 to around $4,450, profit-taking is a normal phenomenon. Whether the current $4,300-$4,285 range can hold will determine whether this pullback is a healthy consolidation or a weakening trend. If $4,285 holds as effective support, and US retail sales fall short of expectations, US Treasury yields continue to decline, and the dollar weakens further, then gold is expected to retest $4,450 and potentially test $4,500. Conversely, if US economic data continues to be stronger than expected, and the dollar and US Treasury yields rebound simultaneously, a break below $4,285 could lead to further corrections towards $4,234 or even $4,184. Overall, the medium-term uptrend for gold remains positive, but in the short term, it has transitioned from a one-sided upward move to a high-level consolidation phase. Going forward, investors should focus on Federal Reserve policy expectations, US retail sales, US Treasury yields, the US dollar index, and changes in global risk premiums. Currently, the most important thing in the market is not chasing short-term fluctuations, but rather observing the breakout direction between the $4285 support level and the $4450 resistance level.
- Risk Warning and Disclaimer
- The market involves risk, and trading may not be suitable for all investors. This article is for reference only and does not constitute personal investment advice, nor does it take into account certain users’ specific investment objectives, financial situation, or other needs. Any investment decisions made based on this information are at your own risk.