Weak US economic data dampened expectations of a Federal Reserve rate hike, pushing gold prices higher.
2026-08-15 02:20:55
Gold prices rose a respectable 0.60% during the European session on Friday (August 14), influenced by a broad-based weakening of the US dollar. Cooling US inflation data this week reduced the likelihood of a Federal Reserve rate hike. Spot gold traded at $4377.06, still below the $4400 mark. Weak US data and a downward revision of market expectations for a September Fed rate hike boosted gold prices. The US dollar index fell 0.27% to 99.6832. Ahead of the September FOMC meeting, investors lowered their bets on a hawkish Fed rate hike. US producer and consumer inflation both declined in July. Continued cooling inflation, a slight increase in initial jobless claims, and declining retail sales data combined to trigger a sell-off in the dollar this week. Data from the US Commerce Department showed that retail sales released on Friday ended a five-month streak of growth, falling 0.6% month-over-month, far below market expectations of a 0.1% increase. Retail sales data, used to calculate GDP consumption expenditures, fell 0.4% month-over-month in July after rising 0.4% in June. The University of Michigan's preliminary August consumer sentiment reading deteriorated further, falling to 51.0 from 55.2. One-year inflation expectations rose to 4.3% from 4.2%, while five-year inflation expectations remained unchanged at 3.3%. No new conflicts in the Middle East provided additional upward momentum for gold prices. US Treasury Secretary Scott Bessant stated that the US would impose unprecedented sanctions on Iran to put pressure on it. Meanwhile, the Strait of Hormuz remained closed, but oil prices did not surge significantly. Additionally, declining US Treasury yields provided support for gold prices. The yield on the 10-year US Treasury note rose 3.5 basis points to 4.684%. Data from PrimeTerminal shows that the swap market is currently pricing in a 31% probability of a Fed rate hike in September, compared to approximately 55% last week. Next week, the US will release housing data, the ADP four-week moving average of employment changes, initial jobless claims, and preliminary manufacturing/services PMI data. Spot gold technical analysis: Gold prices are facing resistance at the 100-day moving average and may continue to fluctuate within a range. 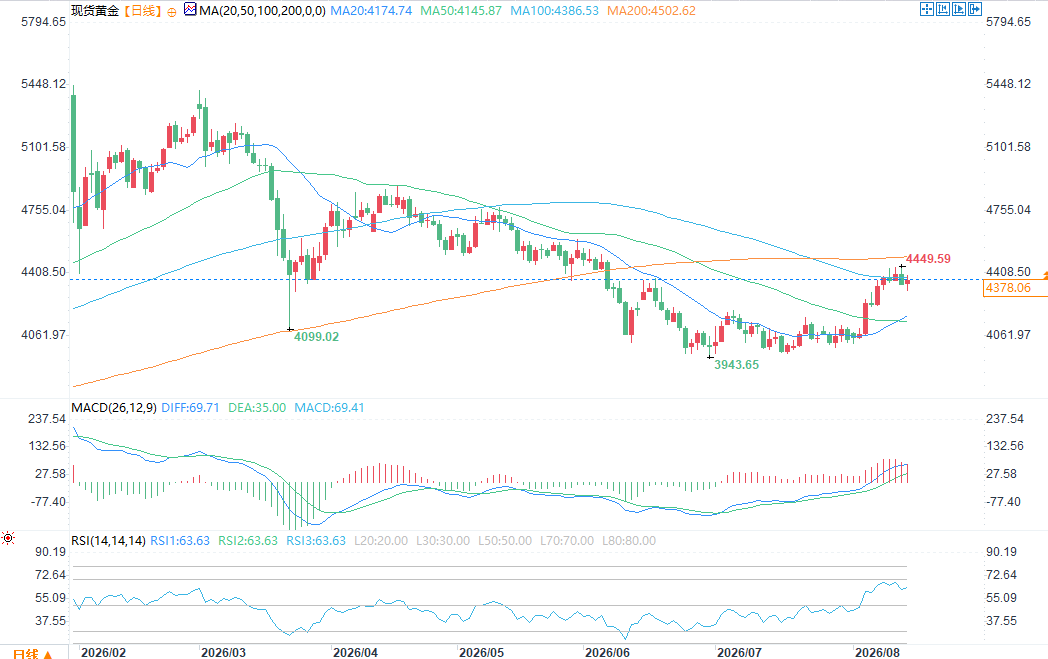 From a technical perspective, gold prices are likely to consolidate around the 100-day simple moving average (SMA) at $4386. The Relative Strength Index (RSI) indicates that bullish momentum remains, but the bulls failed to effectively hold above $4400, suggesting a potential pullback. For the upward trend to resume, spot gold needs to hold above $4400. A successful break above this level would target the psychological level of $4450, followed by the 200-day moving average at $4504. On the downside, the first support level is the intraday low of $4311; if this level is breached, the next support is at $4300. A break below $4300 could see gold prices further decline to the July 6 high of $4202, followed by the 50-day moving average at $4146 and the $4100 level.
From a technical perspective, gold prices are likely to consolidate around the 100-day simple moving average (SMA) at $4386. The Relative Strength Index (RSI) indicates that bullish momentum remains, but the bulls failed to effectively hold above $4400, suggesting a potential pullback. For the upward trend to resume, spot gold needs to hold above $4400. A successful break above this level would target the psychological level of $4450, followed by the 200-day moving average at $4504. On the downside, the first support level is the intraday low of $4311; if this level is breached, the next support is at $4300. A break below $4300 could see gold prices further decline to the July 6 high of $4202, followed by the 50-day moving average at $4146 and the $4100 level.
- Risk Warning and Disclaimer
- The market involves risk, and trading may not be suitable for all investors. This article is for reference only and does not constitute personal investment advice, nor does it take into account certain users’ specific investment objectives, financial situation, or other needs. Any investment decisions made based on this information are at your own risk.